Visualization of Math Concepts: Graphing calculators enable users to plot and understand mathematical functions visually.
Advanced Capabilities: They offer graphing modes, programming, and specialized applications beyond basic calculations.
Educational Value: Widely used in classrooms, they enhance learning and foster technological proficiency.
Math can become challenging, especially with equations and graphs. This is where a graphing calculator proves its usefulness. These devices are capable of performing calculations, plotting graphs, and solving problems efficiently, making them an effective tool for handling both basic and advanced tasks.
A graphing calculator is beneficial whether you’re a student working on assignments or someone solving equations professionally. By integrating multiple features into a single device, it simplifies tasks and saves both time and effort.
This article will discuss what a graphing calculator is, what it does, and how it is used effectively. Whether you’re comparing a scientific vs graphing calculator or using one for graphing functions and analyzing data, these tools are designed to help you accomplish your goals with greater ease.
What is a Graphing Calculator?
A graphing calculator is a handheld electronic device offering advanced mathematical functions. It enables users to perform calculations, plot graphs, and solve equations efficiently. This tool has become essential for students, educators, engineers, and scientists, supporting a variety of tasks from simple arithmetic to intricate mathematical modeling.
Need for Graphing calculators
Approved graphing calculators, such as the TI-84 Plus and Casio fx-CG50, are permitted for certain sections of the DSAT, complementing the exam’s built-in digital calculator. These devices simplify solving algebraic, geometric, and trigonometric problems, offering efficiency for complex equations and function analysis.
They are particularly useful for graph-based questions, enabling students to plot functions, find intersections, and analyze transformations with clarity. By reducing manual errors, these calculators help ensure accuracy, allowing students to focus on problem-solving without distractions.
Graphing calculators align with College Board guidelines, making them a reliable tool for test day. Familiarity with these devices beforehand boosts confidence and efficiency during the math section of the exam.
Scientific Calculators vs. Graphing Calculators: The Major Differences
Features
Scientific Calculators
Graphing Calculators
Approval for dSAT
Approved for use
Approved for use
Graphing Capability
Lacks graphing functions
Can plot and analyze graphs
Functions Needed
Sufficient for most dSAT math sections (e.g., algebra, geometry, basic statistics).
Useful for advanced questions requiring visual graph interpretation.
Ease of Use
Simple and faster for basic calculations.
May take longer to navigate for simple tasks due to complex menus.
Cost Accessibility
More affordable for students ($10–$50).
Higher cost might be a barrier ($50–$200).
Recommendation
Suitable for students comfortable with manual graph interpretation.
Ideal for students who prefer graphing assistance or are accustomed to using one.
Scientific Calculators
Scientific calculators are specialized devices built for performing scientific and mathematical calculations. They offer a wide array of features, including basic arithmetic, trigonometric functions, logarithms, exponentials, and advanced statistical operations. Compared to basic calculators, scientific calculators provide significantly more functionality, catering to a broader range of mathematical tasks.
Functionality: Scientific calculators are specifically created for mathematical and scientific computations. They include a wide range of features such as basic arithmetic, trigonometric functions, logarithms, exponentials, and statistical calculations. These calculators are highly effective for handling complex problems across different scientific fields.
Portability: Scientific calculators are compact and portable, making them easy to use anywhere. Their lightweight design allows them to fit conveniently into a pocket or bag, making them ideal for carrying to classes, exams, or other settings where quick access to calculations is needed.
User Interface: Scientific calculators feature a simple user interface, typically equipped with a limited set of buttons and a compact display screen. Users input calculations directly through button sequences or, in some models, by using reverse Polish notation (RPN) systems.
Cost: Scientific calculators are often more affordable than graphing calculators. They provide strong mathematical functionality at a lower cost, making them a practical choice for students and professionals seeking budget-friendly tools for their calculations.
Standardized Testing: Scientific calculators are commonly permitted in standardized tests and exams. They are frequently approved for use in educational assessments such as college entrance exams and professional certification tests.
Graphing Calculators
Graphing calculators build on the features of scientific calculators by adding advanced graphing capabilities. They enable users to plot functions, visualize equations, analyze graphs, and explore mathematical concepts through graphical representation, making them highly versatile tools for both learning and problem-solving.
Graphing Capabilities: Graphing calculators extend the features of scientific calculators by incorporating advanced graphing functionalities. They enable users to plot functions, visualize equations, analyze graphs, and explore mathematical concepts through visual representation. These calculators support various graphing modes, such as Cartesian, polar, and parametric graphs, providing flexibility for a wide range of mathematical applications.
Programming and Applications: Graphing calculators frequently include programming functionality, allowing users to develop and execute their own programs. They can also support various applications that enhance their capabilities, including tools for statistical analysis, calculus programs, and interactive geometry software.
Larger Display: Graphing calculators have larger display screens compared to scientific calculators. This allows for easier viewing and manipulation of graphs, tables, and other graphical representations.
Educational Integration: Graphing calculators are commonly used in educational settings, particularly in math and science classrooms. They facilitate the exploration of mathematical concepts, data analysis, and visualization, making them valuable tools for teaching and learning.
Cost: Graphing calculators tend to be more expensive than scientific calculators. Their advanced features and graphing capabilities contribute to the higher price tag.
Key Features of Graphing calculators
Graphing calculators are powerful tools that offer a range of key features and functions. They enable users to plot functions, solve equations, analyze data, perform advanced statistical calculations, and even program custom applications. Financial calculators, on the other hand, are more specialized for tasks like loan calculations and investment analysis.
1. High-resolution display: Modern graphing calculators feature clear and vibrant screens that allow for easy reading of graphs, equations, and data.
2. Large memory capacity: These calculators offer ample storage space to store equations, programs, and data sets for future reference.
3. Graphing capabilities: Graphing calculators enable users to plot various types of graphs, such as Cartesian, polar, and parametric, providing visual representations of mathematical functions.
4. Equation solving: They come equipped with built-in solvers that can solve equations numerically or symbolically, helping users find solutions efficiently.
5. Multiple representations: Graphing calculators often allow users to view equations, graphs, and tables simultaneously, facilitating a deeper understanding of mathematical relationships.
6. Data analysis tools: Many graphing calculators offer statistical functions, allowing users to perform regression analysis, calculate probabilities, and generate plots for data interpretation.
Benefits & Applications of Graphing calculators
Graphing calculators provide extensive benefits and are applied across numerous fields. They simplify learning, increase efficiency, and support advanced problem-solving, making them invaluable tools for students and professionals alike.
Enhanced Learning
Graphing calculators enable students to explore mathematical concepts visually and experiment with different scenarios. This hands-on approach promotes a deeper understanding of complex ideas and encourages active engagement with the material.
Efficiency and Accuracy
Tasks that would be time-intensive and prone to error when performed manually can be executed quickly and precisely using graphing calculators. This allows users to focus more on interpreting results and solving problems effectively.
Problem-Solving Flexibility
Graphing calculators offer diverse tools and functions, empowering users to approach challenges from multiple perspectives. This adaptability fosters critical thinking and strengthens problem-solving abilities.
Real-World Applications
Graphing calculators are integral in fields like engineering, physics, and financial planning, where data analysis and modeling play a crucial role in decision-making and innovation.
Engineering Design: Engineers rely on graphing calculators for tasks like designing structures, optimizing systems, and analyzing data in areas such as electrical circuits, mechanical components, and fluid dynamics.
Statistical Analysis: These calculators support scientists in processing experimental data, identifying patterns, and making data-driven conclusions through regression analysis, hypothesis testing, and confidence interval calculations.
Financial Planning: Graphing calculators are useful for evaluating loan payments, assessing investments, and visualizing exponential growth models, making them an essential tool in financial analysis and planning.
Physics Simulations: Students and professionals can use graphing calculators to create simulations that illustrate motion, wave behavior, and electric fields. These visual and interactive tools simplify complex physics concepts through practical experimentation.
Examples of Graphing calculators: The Popular Brands
Brands Name
Best For
Key features
Pricing
Texas Instruments
Standardized test usage
Graphing, statistical analysis, and apps suitable for advanced math
Price starts between $100 and $150
Casio
Budget-conscious students
Affordable with necessary graphing capabilities and intuitive interface
Price starts between $50 and $90
HP
Advanced users
High-speed calculations, touchscreen, and extensive customization options
Texas Instruments is one of the most prominent and well-established brands in the graphing calculator market. Their range includes scientific and graphing calculators, catering to different user needs, from students to professionals.
Pros
Extensive availability of resources.
large user community.
compatibility with standardized exams.
a wide range of models to choose from.
Cons
Higher price range compared to other brands.
Some models may have a steeper learning curve for beginners.
Pricing
$100 - $200+
Casio
Overview
Casio is another reputable brand known for its graphing calculators. While they offer scientific calculator models, their graphing calculators are popular among students and educators for their affordability.
Pros
Affordable options.
user-friendly interface.
Durability.
adequate functionality for most educational needs.
Cons
Limited programming capabilities compared to other brands.
may lack some advanced features found in higher-end models.
Pricing
$50 - $100
HP
Overview
HP has a strong presence in the graphing calculator market, offering calculators with advanced features and robust programming capabilities that appeal to engineering and scientific professionals.
Pros
Advanced functionality.
robust programming capabilities.
CAS in select models.
It has durable build quality.
Cons
Relatively higher price range.
steeper learning curve due to advanced features.
smaller user community compared to other brands.
Pricing
$120 - $300
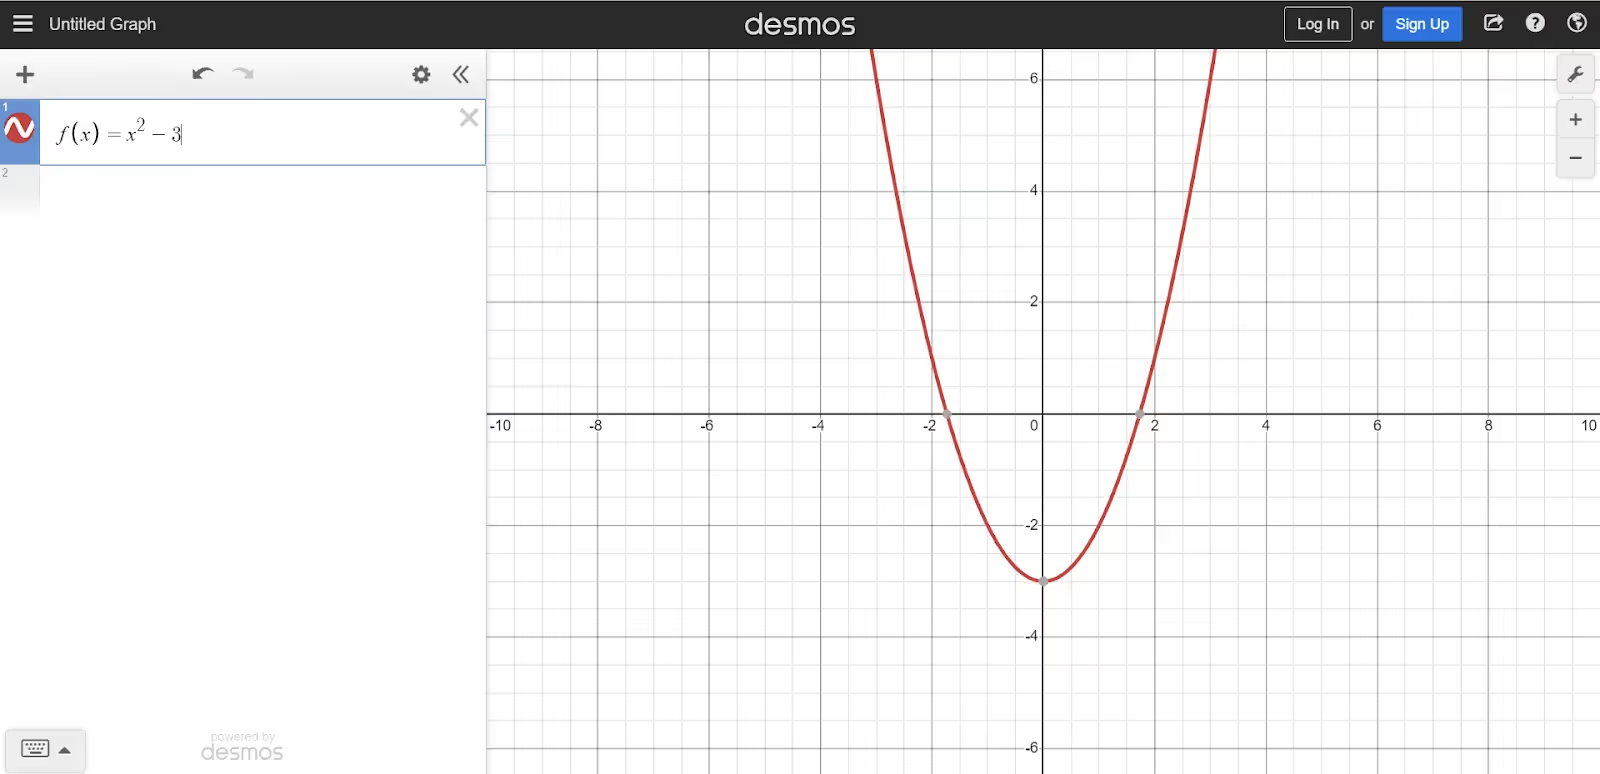
Desmos
Overview
Desmos is a widely recognized and popular brand offering an intuitive and feature-rich online graphing calculator. It provides a user-friendly interface, powerful graphing capabilities, a variety of advanced functions for mathematical calculations, parametric equations, and inequalities. It also offers sliders to visualize the impact of changing parameters.
Pros
User-friendly interface.
real-time graphing.
interactive features.
support for multiple functions and parametric equations.
Cons
Limited advanced mathematical functions.
lack of offline functionality.
Pricing
Free
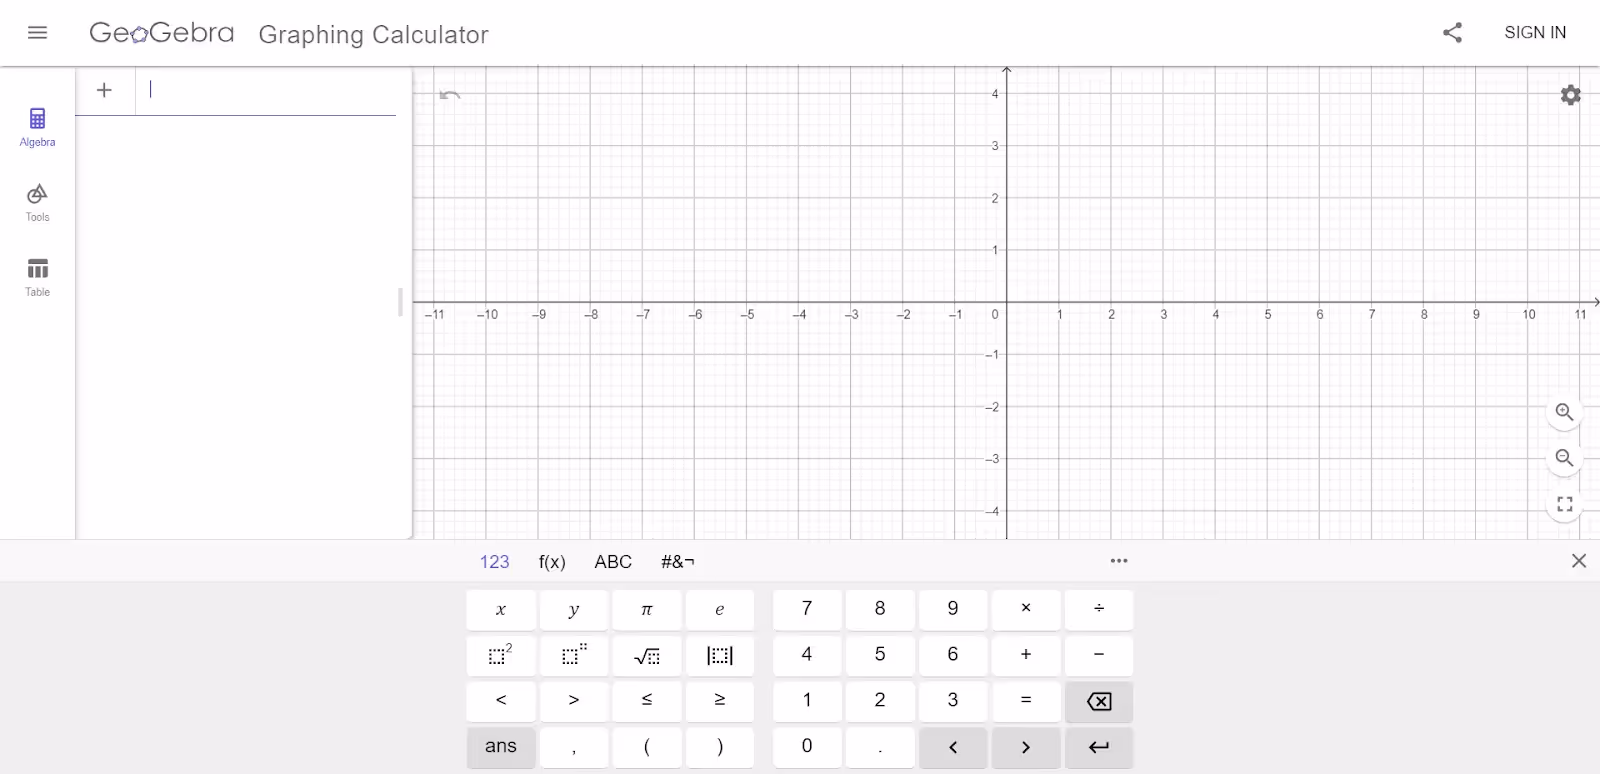
GeoGebra
Overview
GeoGebra is a reputable brand that offers not only an online graphing calculator but also a comprehensive suite of math tools. Its online graphing calculator is known for its versatility, allowing users to create interactive graphs, plot functions, and perform dynamic geometry constructions.
Pros
Dynamic and interactive graphing capabilities.
integration with other GeoGebra tools.
wide range of functions.
Cons
Steeper learning curve.
occasional performance issues with complex calculations.
Pricing
Free
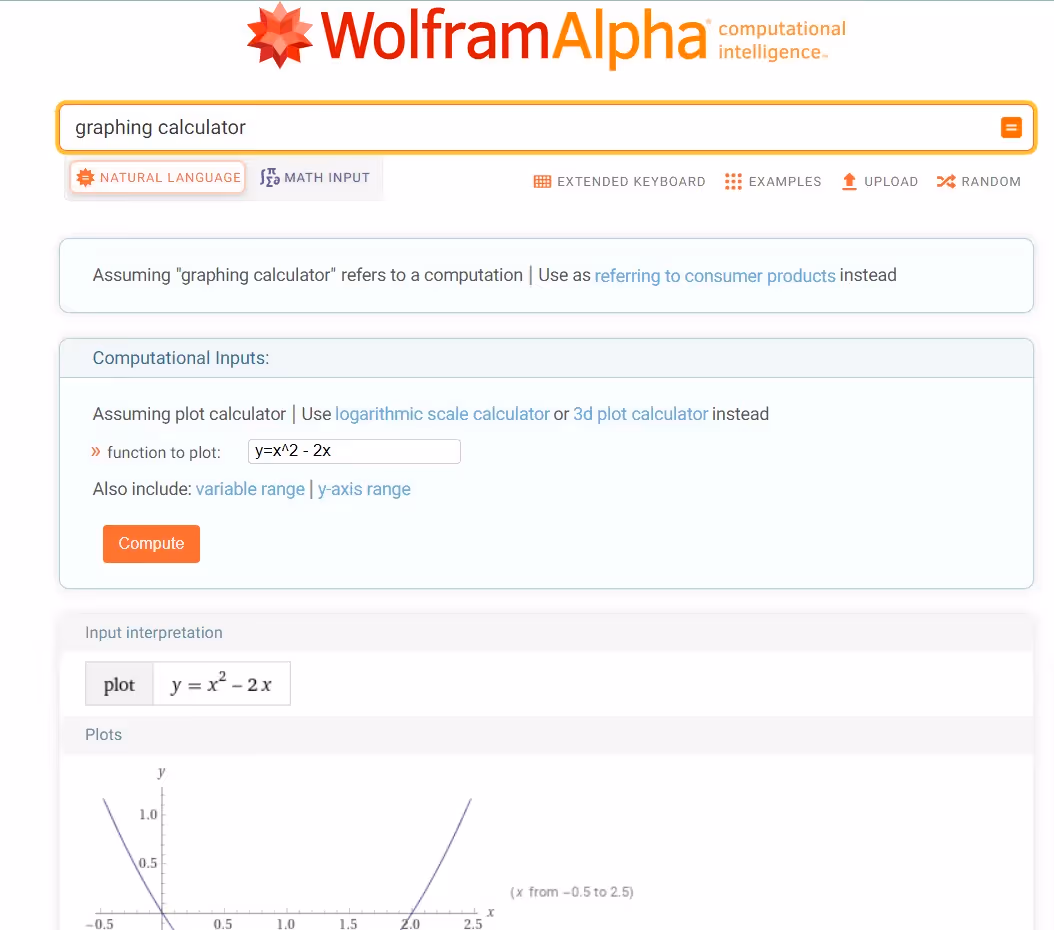
Wolfram Alpha
Overview
Wolfram Alpha is a renowned computational knowledge engine that also offers an online graphing calculator. Known for its computational power, Wolfram Alpha's graphing calculator provides advanced mathematical functions, 3D graphing, and support for various plotting options.
Pros
Powerful computational abilities.
extensive mathematical functions.
3D graphing.
step-by-step solutions for equations.
Cons
Less intuitive interface.
limited customization options.
Some features require a paid subscription.
Pricing
Free ; paid plans starts from $9.99 per month
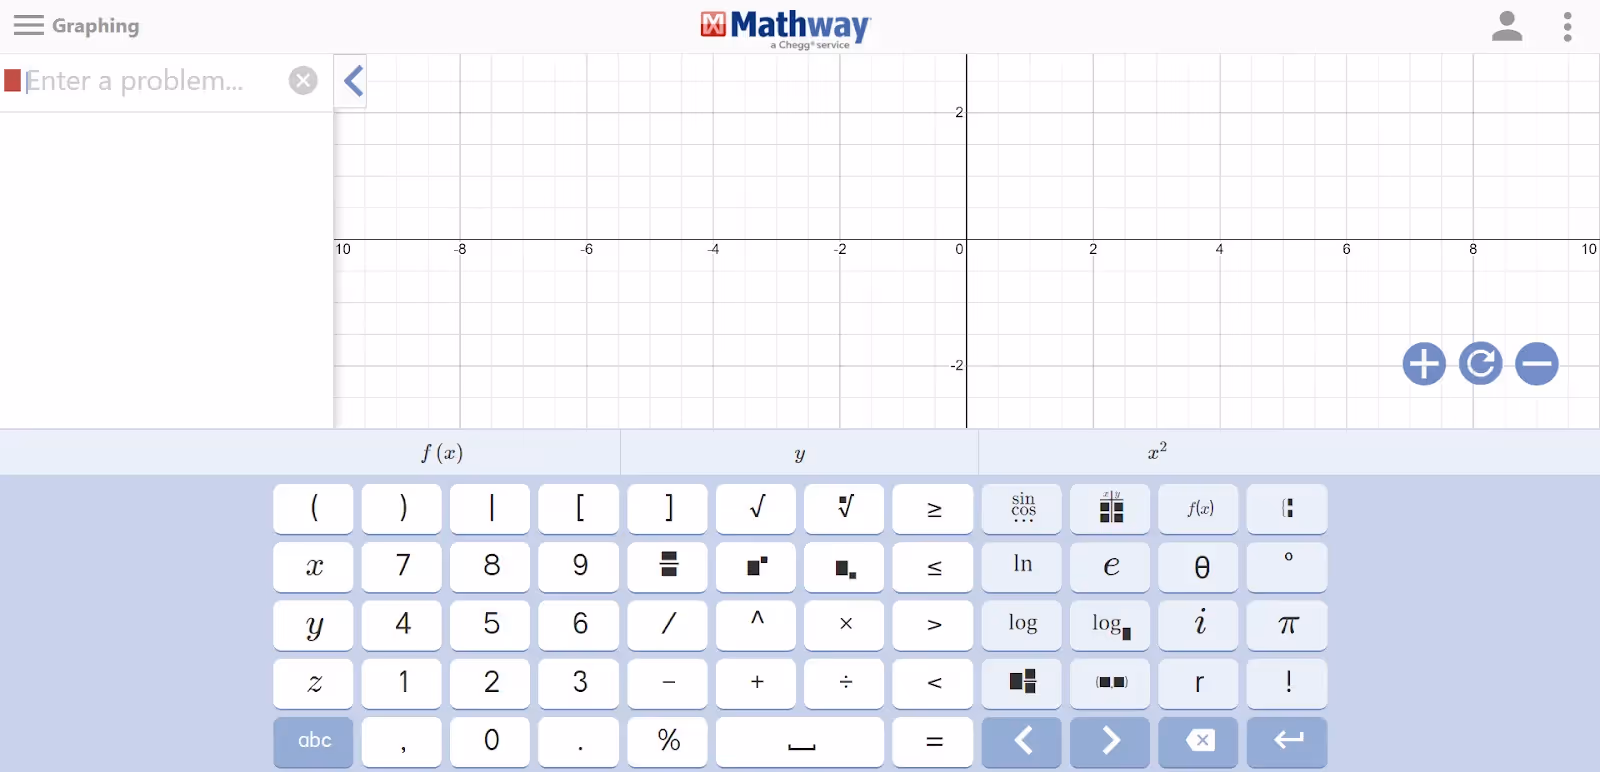
Mathway
Overview
Mathway is a well-known brand that offers an online graphing calculator along with a wide range of math problem-solving capabilities. Its graphing calculator feature allows users to plot functions, analyze graphs, and solve equations. Mathway's calculator supports various math topics, including algebra, calculus, statistics, and more.
Pros
Comprehensive math problem-solving capabilities.
Support for various math topics.
Ability to solve complex equations.
Intuitive interface.
Cons
Limited customization options for graphing.
Some advanced features require a paid subscription.
Pricing
Free ; paid plans starts from $19.99 per month
How to use Graphing calculators: 9 Tips
Graphing calculators, whether physical or online, offer powerful tools for tackling a wide range of mathematical and analytical tasks. Follow these tips to make the most of your device:
Familiarize Yourself with the Features: Take time to explore the functions and layout of your calculator. For physical models, refer to the user manual. For online versions, interact with the interface to understand available options.
Practice Regularly: Using the calculator frequently helps improve accuracy and speed in handling calculations, graphing, and advanced tools.
Utilize Shortcuts: Shortcut keys or commands can save time and make tasks simpler. Learn the ones specific to your device or software for greater efficiency.
Adjust Settings: Set preferences like display brightness, decimal places, or graph defaults on physical calculators. For online calculators, customize features to improve usability.
Save and Organize Work: Store frequently used programs or variables in physical calculators if supported. Online calculators often allow you to save sessions or important data for quick access.
Explore Advanced Functions: Take advantage of tools such as equation solvers, statistical analysis, and calculus functions. Both manual and online calculators provide features to solve complex problems.
Experiment with Graphing Options: Use different types of graphs like scatter plots, histograms, or line graphs to represent data. Both physical and online calculators let you visualize data in various formats.
Use Zoom, Pan, and Comparison Tools: Zoom and pan functions allow better exploration of graphs on online calculators. Use features for multiple plots to compare equations or datasets on both platforms.
Look for Additional Resources: Check for apps, programs, or extensions that expand your calculator’s capabilities. This applies to both physical and online tools.
Challenges of using graphing calculator
Using online graphing calculators offers several advantages, but there are also challenges associated with their use. Here are the detailed challenges of using online graphing calculators:
Internet dependency: Online graphing calculators require a stable internet connection to function properly. This reliance on internet connectivity can be a limitation, especially in areas with poor or no internet access. Users may experience difficulties accessing the calculator or face interruptions while using it.
Privacy and data security: When using an online graphing calculator, users need to be mindful of the privacy and data security risks. Sharing personal or sensitive information while using the calculator may pose privacy concerns. It is important to use reputable and secure online calculator platforms that prioritize data protection.
Compatibility and browser issues: Online graphing calculators may encounter compatibility issues with certain browsers or operating systems. Users may face challenges in accessing the calculator due to compatibility conflicts, requiring them to switch browsers or troubleshoot technical issues.
Limited offline functionality: Unlike physical graphing calculators, online calculators typically require an internet connection to function. This limitation can be inconvenient when users need to work on calculations or graphs in offline environments, such as during exams or in areas with limited internet connectivity.
Learning curve and user interface: Online graphing calculators may have different user interfaces and layouts compared to physical calculators. Users who are accustomed to physical calculators may initially find it challenging to adapt to the online calculator's interface and functionalities. It may take time to become familiar with the layout and features.
Reliability and availability: While many online graphing calculators are reliable and accessible, there may be instances when servers or websites experience downtime or maintenance issues. Users may encounter difficulties accessing the calculator during such times, which can disrupt their work or studies.
Conclusion
Throughout this blog, we explored how graphing calculators have become essential tools in various disciplines. These devices have transformed approaches to learning, problem-solving, and data analysis by enabling users to visualize mathematical concepts, handle advanced computations, and analyze information efficiently. Their application spans education, engineering, and science, providing practical solutions to complex problems. With their role in standardized tests and exam preparation, graphing calculators are instrumental in supporting academic achievements and professional development.
In the world of mathematics and beyond, graphing calculators continue to play a vital role in empowering users with computational and analytical capabilities.
ABOUT THE AUTHOR
Hazel Ricky
Content Marketing Associate
Hazel Ricky is a passionate content marketer with a knack for creating engaging and informative content that appeals to target audiences. She has a strong understanding of content marketing best practices and is experienced in writing blog posts, articles, social media posts, email newsletters, and more.
Tutors Edge by EdisonOS
Get Exclusive test insights and updates in our newsletter, curated to help tutors stay ahead!
Thanks for subscribing! The 'Digital SAT Breakdown Report' has reached your inbox!
Oops! Something went wrong while submitting the form.


.avif)


.png)
.webp)
