Learn how to convert SHSAT raw scores to scaled scores with our comprehensive guide. Understand the scoring system, use conversion charts, and calculate your SHSAT score accurately.
SHSAT admissions rely on scaled scores, not raw correct answers.
Raw-to-scaled conversions change yearly based on test difficulty.
Balanced ELA and Math performance drives competitive composite scores.
The SHSAT raw score to scaled score conversion is a complex process, and the scoring system is nonlinear. Students often fail to fully understand not only the SHSAT score conversion process but also the correct way of using their practice test scores to boost performance.
As the sole factor used for admissions to the Special High Schools of NYC, the SHSAT (Specialized High Schools Admissions Test) score is of critical importance. Which is why we’ve prepared this guide to explain all you need to know about SHSAT scores.
Here, we cover:
What is a raw score and what is a scaled score
How scoring works with the help of a conversion chart
How to interpret SHSAT scores for admissions to the specialized NYC schools
What to use raw-to-scaled conversion to boost test prep
How a powerful platform can transform a student’s SHSAT test prep journey
But first, a simple question: why should you understand everything about SHSAT raw scores and scaled scores?
Why it’s important to understand SHSAT raw scores and scaled scores
Understanding how to calculate SHSAT scores is crucial for test prep, interpretation of practice-test results, goal-setting, and even the school placement strategy.
What’s more, by understanding the conversion, students realize they’re competing against one another, not aiming for a fixed benchmark. Understanding how conversion of raw scores to scaled scores works is critical for interpreting practice test results.
All this makes it extremely important to understand how to convert SHSAT raw score to scaled score.
Understanding SHSAT Scoring: Raw vs. Scaled Scores
Let’s understand the key terms associated with the SHSAT scores.
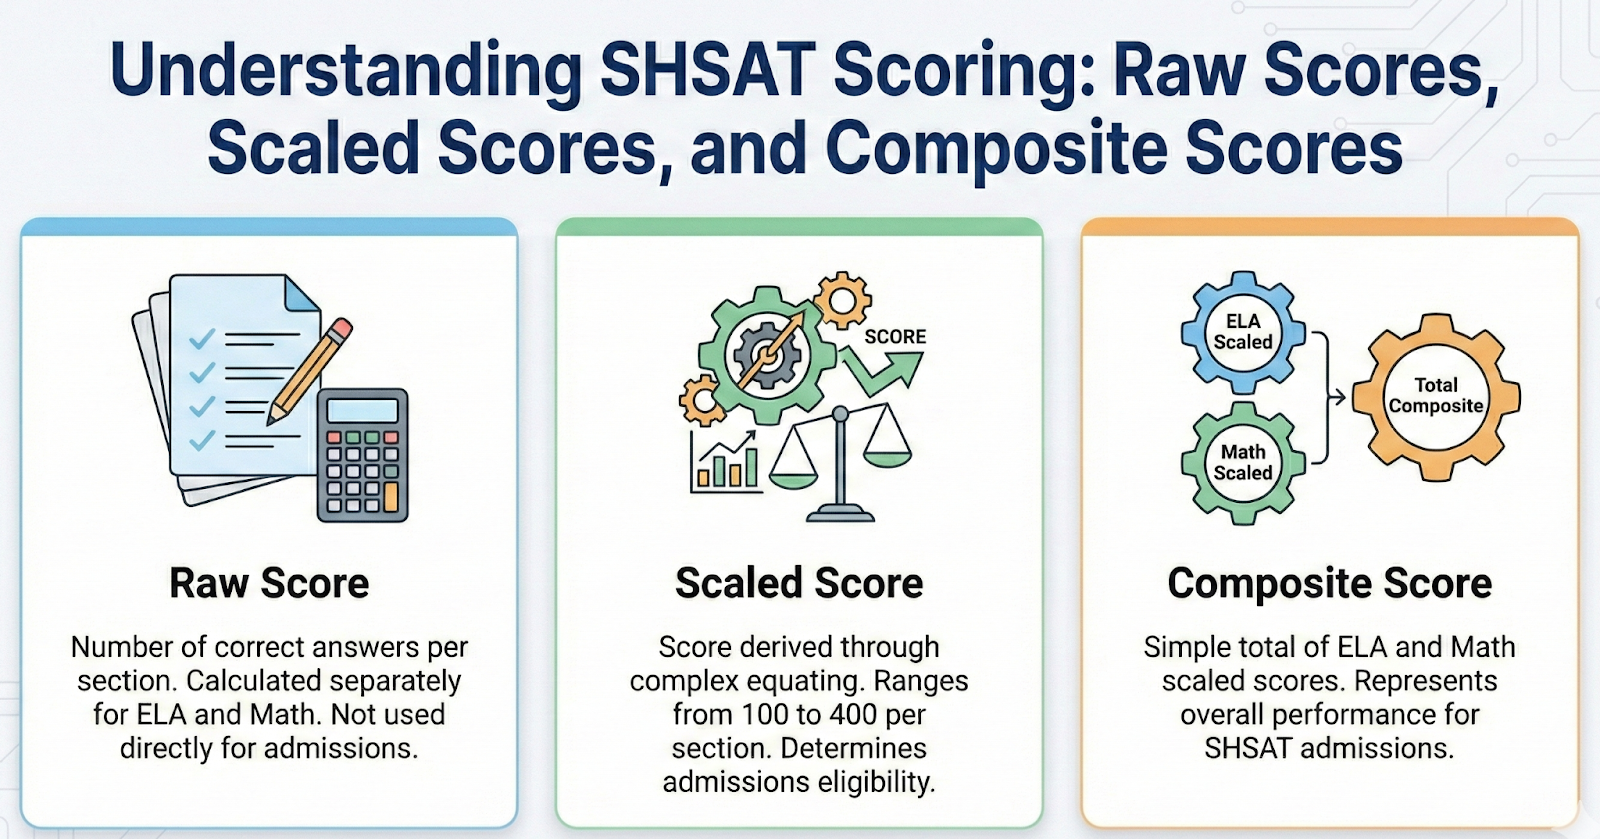
What Is a Raw Score?
In the SHSAT, raw score is simply the number of correct answers in each section. It is calculated separately for the ELA section and the Math section.
Raw scores are not used directly for the admission process.
What Is a Scaled Score?
In the SHSAT, scaled score is the score the test-taking body arrives at by using a process known as equating.
This process is proprietary and complex, and is not disclosed publicly.
Each section produces its own scaled score. The range of scaled score in each section is between 100 and 400. Admissions are decided on the basis of the scaled scores.
What is a composite score
The SHSAT composite score is the simple total of the scaled scores of the ELA and Math sections of a student.
The SHSAT is administered by the New York City Department of Education (NYC-DOE). Because the scores determine admissions, the NYC-DOE uses a standardized process to ensure fairness and consistency.
The Two-Section Structure
The SHSAT has two sections: English Language Arts and Mathematics. Each section contains 57 questions, for a total of 114.
However, 10 questions in each section are unscored experimental items. These are mixed in, and students don’t know which ones they are. So only 47 questions per section count toward the score.
The Scoring Process
SHSAT scoring follows a multi-step process. First, a raw score is calculated for each section: one point per correct answer. There is no penalty for wrong or skipped questions. Students with the same number of correct answers in a section receive the same raw score, regardless of test version.
Raw scores are then converted into scaled scores using a statistical conversion table. The maximum scaled score per section is 400.
Students with identical raw scores may receive different scaled scores depending on the test version.
Scaled scores are non-linear, which means two things:
They do not increase in direct proportion to the number of correct answers. Doubling the raw score does not double the scaled score.
Each additional correct answer can affect the scaled score differently. In the middle range, one extra question may add only a few points, while near the top or bottom, the same gain can have a larger impact.
Why Scaled Scores Matter
Converting raw scores to scaled scores removes differences between test versions. This ensures that students who took an easier form of the test do not have an advantage over those who took a more difficult one.
SHSAT Raw Score to Scaled Score Conversion Chart
Using different sources, we created a hypothetical situation for four students and analyzed how their raw scores correlated with scaled scores.
ELA section conversion
The adjoining table shows raw scores and their corresponding scaled score of four students for the ELA section. While the names are not real, the conversion is actual.
Student name
Anastasia
Burt
Carol
Doug
ELA raw score
16
23
30
51
ELA scaled score
164
194
218
308
Math section conversion
The raw-versus-scaled scores chart shown here will give you an idea of how conversion works in the Math section.
Student name
Anastasia
Burt
Carol
Doug
Math raw score
17
24
31
52
Math scaled score
164
198
222
318
Composite score calculation
Our internal tools don’t rely on third-party calculators. Based on past trends and our research, our software automatically converts practice test results and presents detailed score analysis.
With EdisonOS, tutors don’t have to rely on third-party calculators. Our built-in diagnostic tools automatically convert raw practice test results into scaled scores and composites.
Because the official conversion formula isn’t public, all raw-to-scaled charts, including the one you see here, should be treated as estimates.
Raw score
Scaled score
(Conservative estimate)
Scaled score
(Liberal
estimate)
0-5
0 - 69
0 - 72
6-10
79 - 110
80 - 112
11-15
116 - 135
129 - 149
16-20
139 - 152
160 - 178
21-25
155 - 166
185 - 198
26-30
169 - 179
202 - 218
31-35
181 - 192
222 - 234
36-40
195 - 207
238 - 252
41-45
211 - 229
254 - 270
46-50
234 - 262
276 - 298
50-55
271 - 318
308 - 350
56-57
333 - 350
370 +
Interpret your SHSAT score
Students are allowed to take the actual SHSAT up to two times: once while in grade 8 and once while in grade 9. So they need to interpret the scores of their practice SHSAT tests very seriously.
Here are the three steps to follow in order to make the most of every practice test:
Step 1: Use a conversion chart to estimate the scaled scores….
Step 2: Next, students can compare their score with the cutoff scores of the specialized high schools they are targeting. This will show the students the gap they still need to cover.
Step 3: Finally, they should identify the areas for improvement. What kind of questions trouble them the most? What strategies aren’t working? All these questions will help them make the most of the practice SHSATs.
SHSAT Score Ranges and What They Mean
The SHSAT scores are important because they determine admissions to NYC’s highly competitive schools. The adjoining table shows the score ranges and where they are likely to lead a student to.
Score Range
Performance Level
School Eligibility
700+
Excellent
Competitive for top-tier schools (Stuyvesant, Bronx Science, Brooklyn Tech)
600-699
Strong
Good chances at most specialized schools
500-599
Above Average
Competitive for mid-tier specialized schools
400-499
Average
May qualify for some specialized schools depending on cutoffs
Below 400
Below Average
Additional preparation recommended
Note: Although the table mentions scores of 700 and above, in real-life they are quite rare.
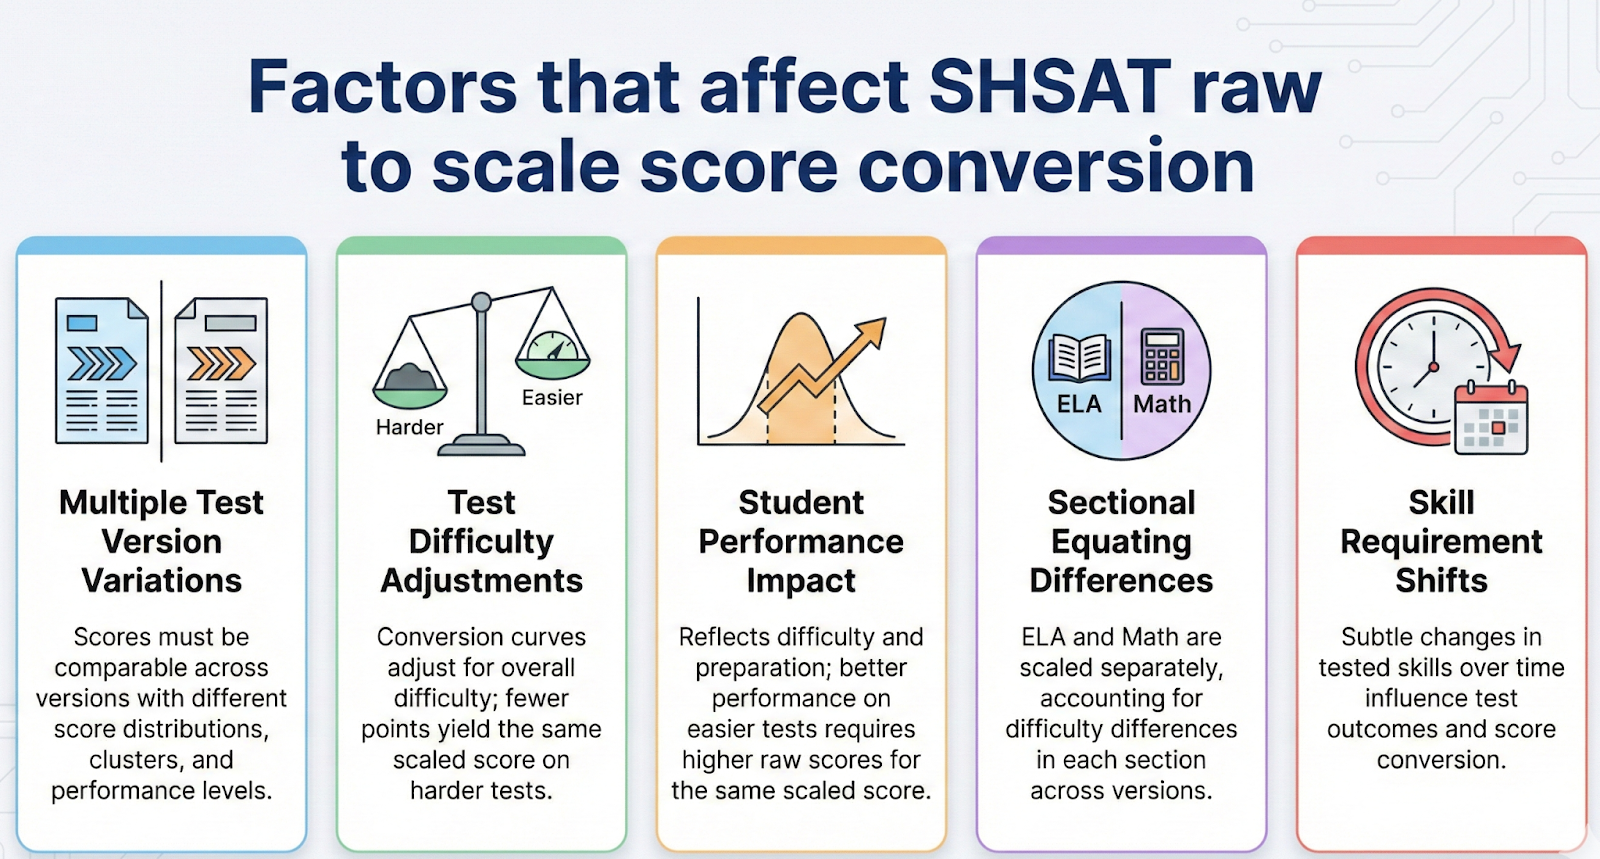
Factors that affect score conversion
Why do raw scores convert to scaled scores differently each year? Because several factors influence the conversion, and changes in any of them can shift how raw scores translate into scaled scores.
Here are the key factors affecting raw-to-scaled conversion:
Test versions
Different SHSAT forms may vary slightly in difficulty. That affects how raw scores are distributed, where score clusters appear, and how performance compares across versions.
Overall test difficulty
Each test includes questions of varying challenge levels. If a version is statistically harder, fewer raw points may be needed to reach a given scaled score. On an easier test, more raw points may be required.
Student performance distribution
This reflects both test difficulty and student preparation. In a year with stronger performance or an easier test, higher raw scores may be needed to match previous scaled scores.
Section-level equating
ELA and Math are scaled separately before being combined. One test form may have a harder ELA section, while another may have a harder Math section. This affects scaling.
Periodic skill shifts
Gradual shifts in the skills emphasized over time can influence performance patterns and, in turn, score conversion.
How to Use Raw-to-Scaled Conversion for Test Prep
Practice test score conversion can guide smarter prep and help raise SHSAT scores. Use this four part strategy.
Setting realistic score goals
Keep three things in mind when setting goals.
Bigger improvements need bigger changes. In the same practice test, a student scoring above 45 raw points has a better shot at Bronx Science than one below 32. Encourage ambitious but realistic targets.
Cutoffs are minimums. The cutoff is the score of the last admitted student. Matching it may still not be enough if applicant preferences shift. Aim higher than the cutoff.
Work backward. Once students choose target schools, estimate the scaled scores needed and plan preparation accordingly.
Tracking progress over time
Progress usually comes in small steps. Track performance regularly, even when gains seem minor.
Score conversions help compare practice tests. These conversions are estimates, so focus on trends rather than tiny changes. Use the same method each time for fair comparison.
Identifying weaknesses
A strong score in one section can offset a weaker one, but only to a point. Students should not ignore either section.
ELA and Math scores are reported separately. Use this to pinpoint weak areas. Look at whether mistakes come from gaps in understanding, timing issues, or strategy problems.
Pacing and strategy
Shape pacing and test strategy around three ideas.
Non-linear scoring means one extra correct answer can affect scaled scores differently at different ranges.
Section balance matters. A very high score in one section can help if the other is weaker.
Encourage students to attempt as many questions as possible. Build a pacing plan that increases attempts without hurting accuracy.
Common mistakes when converting SHSAT scores
Practice tests help identify weak areas and track progress. But mistakes in converting raw scores to scaled scores can give a misleading picture of performance.
Avoid these common mistakes while converting SHSAT scores:
Forgetting that conversions are approximations
All practice test conversions are approximate. Very high practice scores should not lead to overconfidence. Low scores should not cause panic. Smart practice and strategy can still lead to strong improvement.
Using inaccurate conversion tools
Use reliable conversion tools. Avoid any chart that shows scores very different from other reasonable estimates.
Using outdated conversion charts
Charts older than five years are unreliable because conversion scales change over time.
Not accounting for test form variations
Different test versions vary in difficulty. Applying the same conversion to every form can produce inaccurate scores.
Comparing scores without context
A score from one practice source cannot be directly compared with a score from another without understanding differences in test level and scaling.
The number of seats available at each school: A school with fewer seats and a larger number of students vying for the same will have a higher cutoff.
Score of the interested students: When more students with high composite scores apply for a school, the cutoff rises. Conversely, when the overall scores of the applicants are low, the cutoff will turn out to be lower.
Overall matrix: In 2024, HSMSE at City College was the second most-preferred school while Staten Island Tech was the fifth most-preferred school. In 2025, Staten Island Tech jumped three ranks, becoming the second most-preferred school. As you can see, the preferences can change every year. So in general, the intermeshing of number of applicants, number of seats, overall performance of the students, and admission preferences of the students keeps the cutoffs dynamic.
Here are the SHSAT cutoff scores for NYC Specialized High Schools in the past five years:
School
2021
2022
2023
2024
2025
Stuyvesant High School
559 (#1)
563 (#1)
561 (#1)
561 (#1)
556 (#1)
Staten Island Tech
525 (#2)
527 (#3)
521 (#3)
519 (#5)
527 (#2)
HSMSE at City College
515 (#4)
532 (#2)
518 (#5)
542 (#2)
526 (#3)
Bronx High School of Science
517 (#3)
524 (#4)
521 (#3)
526 (#3)
518 (#4)
Queens HS for Science at York
515 (#4)
523 (#5)
527 (#2)
524 (#4)
518 (#5)
Brooklyn Technical HS
493 (#7)
506 (#7)
503 (#7)
507 (#7)
505 (#6)
HS of American Studies at Lehman
502 (#6)
516 (#6)
510 (#6)
514 (#6)
504 (#7)
Brooklyn Latin School
481 (#8)
497 (#8)
493 (#8)
492 (#8)
496 (#8)
Note: The numbers placed inside the parenthesis are the ranking of the schools purely on the basis of the cutoff scores. For instance, by the cutoff scores, HSMSE at City College ranked #5 in 2023, #2 in 2025, and #3 in 2025. This doesn’t reflect our opinion about the school.
You’ll notice two things from this table.
Even for the top-ranked school, the cutoff can change every year. Stuyvesant High School, consistently ranked #1 in cutoffs, shows variations in cutoffs nearly every year.
Cutoffs don’t always increase, even for the #1 school. The cutoff for Stuyvesant High School was higher in 2022 than in 2025, although it was ranked #1 in both years.
How EdisonOS Helps with SHSAT Score Analysis
There are at least four ways EdisonOS helps tutors make their students shine.
Adaptive testing: Starting 2026 the SHSAT will be adaptive in nature. The test will adjust its questions based on the student’s performance. You can have your students experience how a digital test works by having them take a free digital SAT from our platform.
Build Your Own Test: Feel like offering your students a test that you’ve specially built for them? Use EdisonOS’s BYOT (Build Your Own Test) feature to add questions and create a test that only your students can take.
Score conversion: Our unique and accurate SHSAT raw score to scaled score conversion makes sure your students get the most accurate picture of their performance. Be seen as the tutor with the most reliable understanding of scores.
Comprehensive analysis: Our SHSAT test-prep platform gives you everything you need as an SHSAT tutor. View second-by-second analysis of the time students spend on their test. Check how they’ve performed on every question, identify their weak spots, and help them correct mistakes. Help prepare study plans and empower your students to reach their dream school.
FAQ
1. What’s the maximum scaled score in the SHSAT?
Theoretically, the maximum score possible is 800 (400 per section). However, the SHSAT raw score to scaled score conversion algorithm uses sophisticated calibrations. That makes it nearly impossible to score a perfect 800.
2. What is a good score in the SHSAT?
SHSAT scores in the range of 700 to 740 are considered exceptionally high. Any score above 600 is considered quite competitive.
3. What will be the cutoffs for the Specialized High Schools of NYC next year?
Cutoffs change every year, so exact predictions aren’t possible. Reviewing past trends can give a general sense of competitiveness.
ABOUT THE AUTHOR
Aishwarya Lakshmi
Content Writer
Aishwarya Lakshmi is a SaaS content writer who crafts research-driven, value-packed content for leading SaaS and technology brands. In her free time, she explores local cafes in the city and nurtures her community, "Quillspire."
Tutors Edge by EdisonOS
Get Exclusive test insights and updates in our newsletter, curated to help tutors stay ahead!
Thanks for subscribing! The 'Digital SAT Breakdown Report' has reached your inbox!
Oops! Something went wrong while submitting the form.


.png)
.webp)
