Digital SAT Structure (2026): The exam consists of two adaptive sections—Reading & Writing and Math—designed to assess core academic skills in a shorter, fully digital format.
Adaptive Testing Model: The Digital SAT uses a multistage adaptive system, adjusting question difficulty based on student performance to deliver a more personalized and precise score.
Built-In Digital Tools: Students have access to integrated features such as an on-screen calculator (Desmos), annotation tools, and question flagging to improve navigation and efficiency.
Targeted Preparation Approach: Effective Digital SAT prep focuses on pacing, strategic problem-solving, and skill mastery rather than volume-based practice alone.
Digital SAT Format at a Glance
The digital SAT format consists of 2 sections (Reading & Writing and Math), divided into 4 modules total, with 98 questions completed in 2 hours 14 minutes of testing time. The test is fully adaptive: how you perform in Module 1 of each section determines the difficulty of Module 2. Students take it on-screen using the Bluebook app, with built-in tools like the Desmos calculator, annotation, and question flagging.
Passages are shorter. The experience is on screen. Scores arrive sooner. The score scale, however, remains the same, so colleges interpret results just as they always have.
Each section is divided into modules, creating a structured flow without making the experience rigid. Students can move freely within a module, review answers, and adjust their approach before it closes.
Each Reading and Writing module is for 32 minutes, while each Math module is for 35 minutes. Students have 64 minutes to complete the Reading and Writing section and 70 minutes to complete the Math section.
The most important shift is adaptive testing. Instead of giving every student the exact same set of questions, the Digital SAT adjusts difficulty based on performance. In simple terms, the test responds to how you are doing.
Instead of simply being a digital copy of the old SAT, it is a redesigned version built to measure ability more precisely in a modern format.
How Navigation Works
Students can move back and forth within a module.
Once time ends for Module 1, the system automatically moves to Module 2.
There is no break between modules within the same section.
After completing the Reading and Writing section, students receive a 10-minute break before starting Math.
The Major Change: Adaptive Testing
The biggest shift from paper to digital is adaptive testing.
This means the test adjusts difficulty based on performance in the first module.
Stronger performance leads to a more challenging second module.
Lower performance leads to a less difficult second module.
This structure allows the Digital SAT to measure ability more precisely in less time.
How many questions are on the Digital SAT?
The Digital SAT has 98 questions total, split across two adaptive sections:
Section
Module 1
Module 2
Total
Reading & Writing
27 questions
27 questions
54 questions
Math
22 questions
22 questions
44 questions
Total
49
49
98 questions
Of the 98 questions, 4 are experimental (pretest) questions, 2 in each section, which do not count toward your score. They're used by the College Board to test new questions for future exams. You won't know which questions are experimental during the test, so answer every question as if it counts.
How Long Is the Digital SAT? (Testing Time vs Total Seat Time)
There are two numbers to know: actual testing time and total seat time at the testing center.
Segment
Duration
Reading & Writing (2 modules × 32 min)
64 minutes
Break
10 minutes
Math (2 modules × 35 min)
70 minutes
TOTAL TESTING TIME
2 hours 14 minutes (134 min)
+ Check-in, instructions, ID verification
~20–30 minutes
TOTAL SEAT TIME AT CENTER
~2 hours 44 minutes (164 min)
Plan to block at least 3 hours on test morning. Arriving early reduces stress, and check-in cannot be rushed.
Digital SAT Sections and Time Breakdown
1. How Digital SAT Scoring Works
Understanding the scoring system and the key standardized testing terms behind it can directly impact how you approach the test.
Two critical ideas:
Not all questions carry the same weight.
Your performance in Module 1 (Base module) determines your scoring range for the section.
Adaptive Scoring Explained
The Digital SAT uses adaptive testing.
Let’s compare two students: Fiona and Vince.
Fiona performs poorly in her Base module in Math.
Vince performs strongly in his Base module.
Because of this:
Fiona receives an Adaptive module with mostly easier questions.
Vince receives an Adaptive module with mostly harder questions.
Even if some skills overlap, the difficulty level differs.
Harder questions carry more scoring weight.
This creates two important outcomes:
Fiona’s section score now has a ceiling. She cannot score beyond a certain maximum.
Vince’s section score has a floor. It is unlikely to fall below a certain minimum.
Takeaway
Do well in the Base module, and you secure access to higher-weight questions.
Struggle in the Base module, and your scoring potential becomes limited.
Information & Ideas (main idea, details, inference)
~26%
~12–14 questions
Standard English Conventions (grammar, punctuation)
~26%
~11–15 questions
Expression of Ideas (transitions, rhetoric, synthesis)
~20%
~8–12 questions
Math Domain Weights (44 questions total)
Domain
Approximate Weight
Question Count
Algebra (linear equations, inequalities, systems)
~35%
~13–15 questions
Advanced Math (nonlinear functions, equivalents)
~35%
~13–15 questions
Problem-Solving & Data Analysis (ratios, %, stats)
~15%
~5–7 questions
Geometry & Trigonometry (angles, area, triangles)
~15%
~5–7 questions
These percentages reflect College Board guidance for the digital SAT. Question counts vary slightly between test forms.
Is the Digital SAT All Multiple Choice?
No, the digital SAT is not entirely multiple choice. Most questions are multiple choice, but some Math questions require students to type in a numerical answer instead of picking from options.
Here's the breakdown:
Reading & Writing (54 questions): 100% multiple choice. Every question has 4 answer options.
Math (44 questions): ~75% multiple choice + ~25% Student-Produced Response (SPR). SPR questions ask you to type the answer directly into a text box, no answer choices shown. Common SPR types include arithmetic answers, fractions, and decimals.
SPR questions don't have a penalty if you guess wrong, but they're harder to game by elimination, so accuracy matters more. Plan to spend a few extra seconds verifying your answer format (e.g., decimals vs. fractions) before submitting.
Unlike the paper SAT, which includes two Verbal sections — one more focused on reading comprehension and one more focused on grammar — the digital SAT has one Reading & Writing section, in which questions centring on various verbal skills are mixed. Each question is accompanied by a passage that ranges from a single sentence to an entire paragraph. Here are some types of questions you can expect to see in the Reading & Writing section of the digital SAT.
1. Vocab-in-context
These questions ask students to select the most logical and precise vocabulary word to fill in a blank based on knowledge of the words themselves and the context of the passage.
2. Paired passages
These questions ask students to analyze and compare the authors' points of view of two different passages.
3. Purpose
These questions ask students to identify the purpose and impact of a single sentence in a larger passage.
4. Character
These questions ask students to analyze and summarize information about certain characters based on the information provided about those characters in a passage. Some passages include many characters, requiring students to avoid distractions and focus on the character the question identifies.
5. Main idea
These questions ask students to synthesize a passage's main idea or primary purpose. Students must understand how to discern more extraneous details from a passage'spassage's central themes.
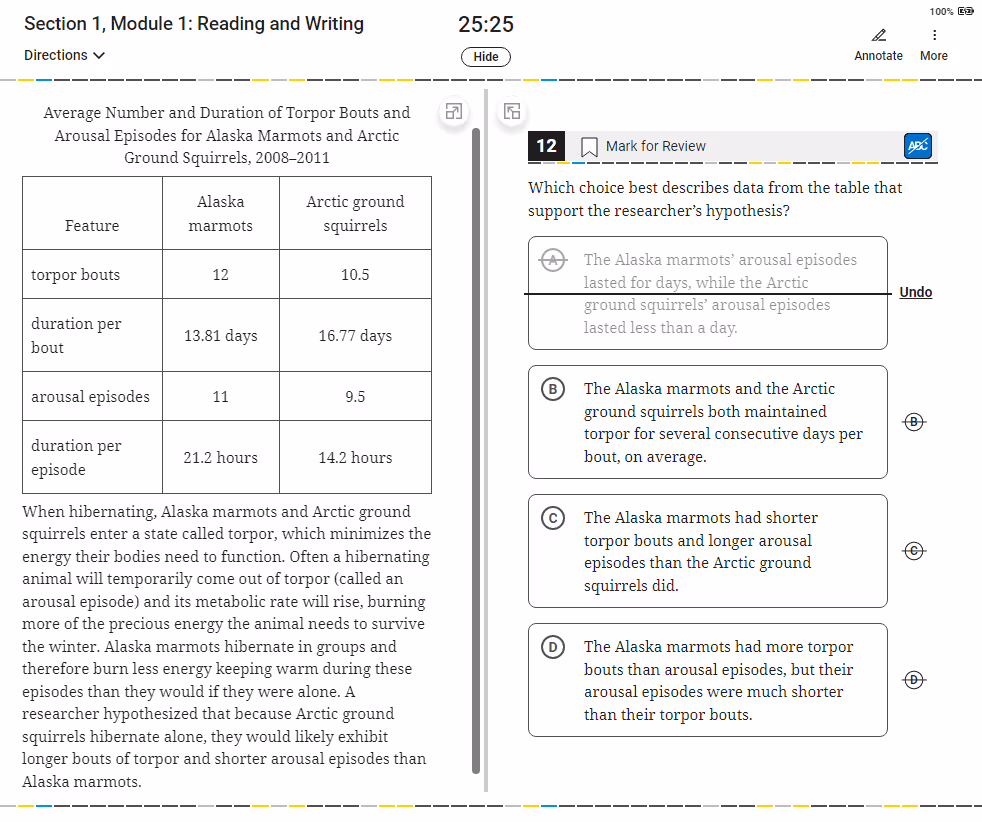
6. Reading graphs & charts
As in the paper SAT, the verbal section of the digital SAT includes some questions that combine reading comprehension with more quantitative skills. Questions like these test a student's ability to correctly interpret graphs and charts and apply that information to a written passage.
7. Grammar
These questions test a student'sstudent's grasp of grammatical concepts like punctuation, parts of speech, and proper sentence structure.
8. Transition
These questions ask students to select the transition word that most closely reflects the relationship between two sentences or clauses.
9. Relevance
These questions ask students to identify the most relevant information in a list of loosely related pieces based on a stated goal.
Math
On the paper SAT, the two Math sections (Calculator and No-Calculator) are further subdivided into multiple choice questions and "grid-in" questions (on which students write in their answers rather than selecting from provided options). Math on the digital SAT will be different in two crucial ways. First, calculators will be allowed in the entire section. Second, the section includes a mixture of multiple-choice questions and free-response questions.
That being said, the content areas covered by the digital SAT seem extremely similar to those covered by the paper SAT! Here are some of the content areas you can expect to see in the Math section of the digital SAT.
Exponents & Radicals
Exponential vs. Linear Growth
Expressions
Manipulating & Solving Equations
Systems of Equations
Word Problems
Lines
Quadratics
Triangles
Circles
Trigonometry
Probability
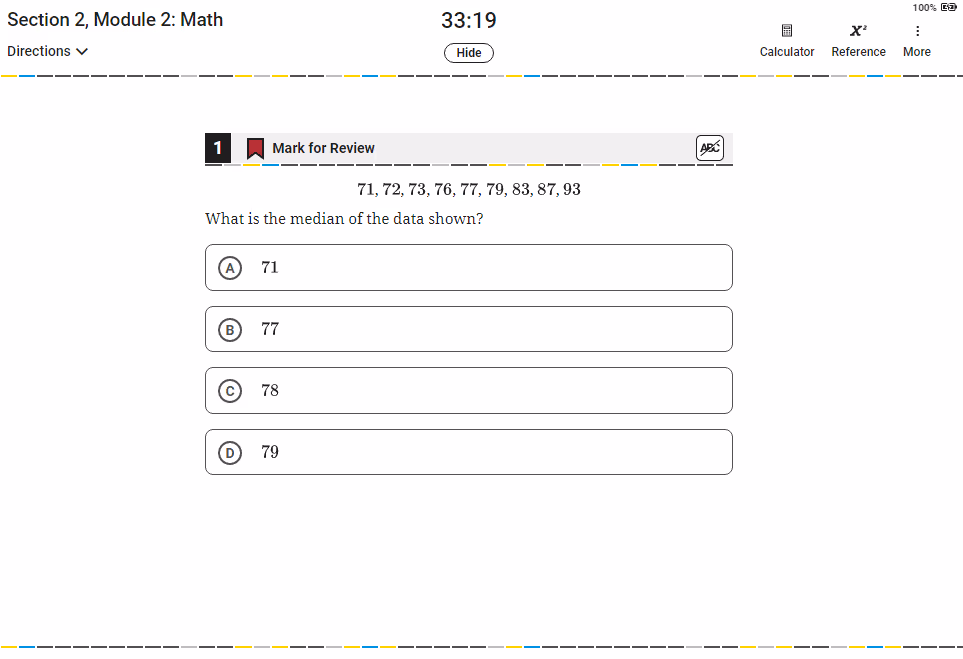
Statistics
See an example of each of these content areas below!
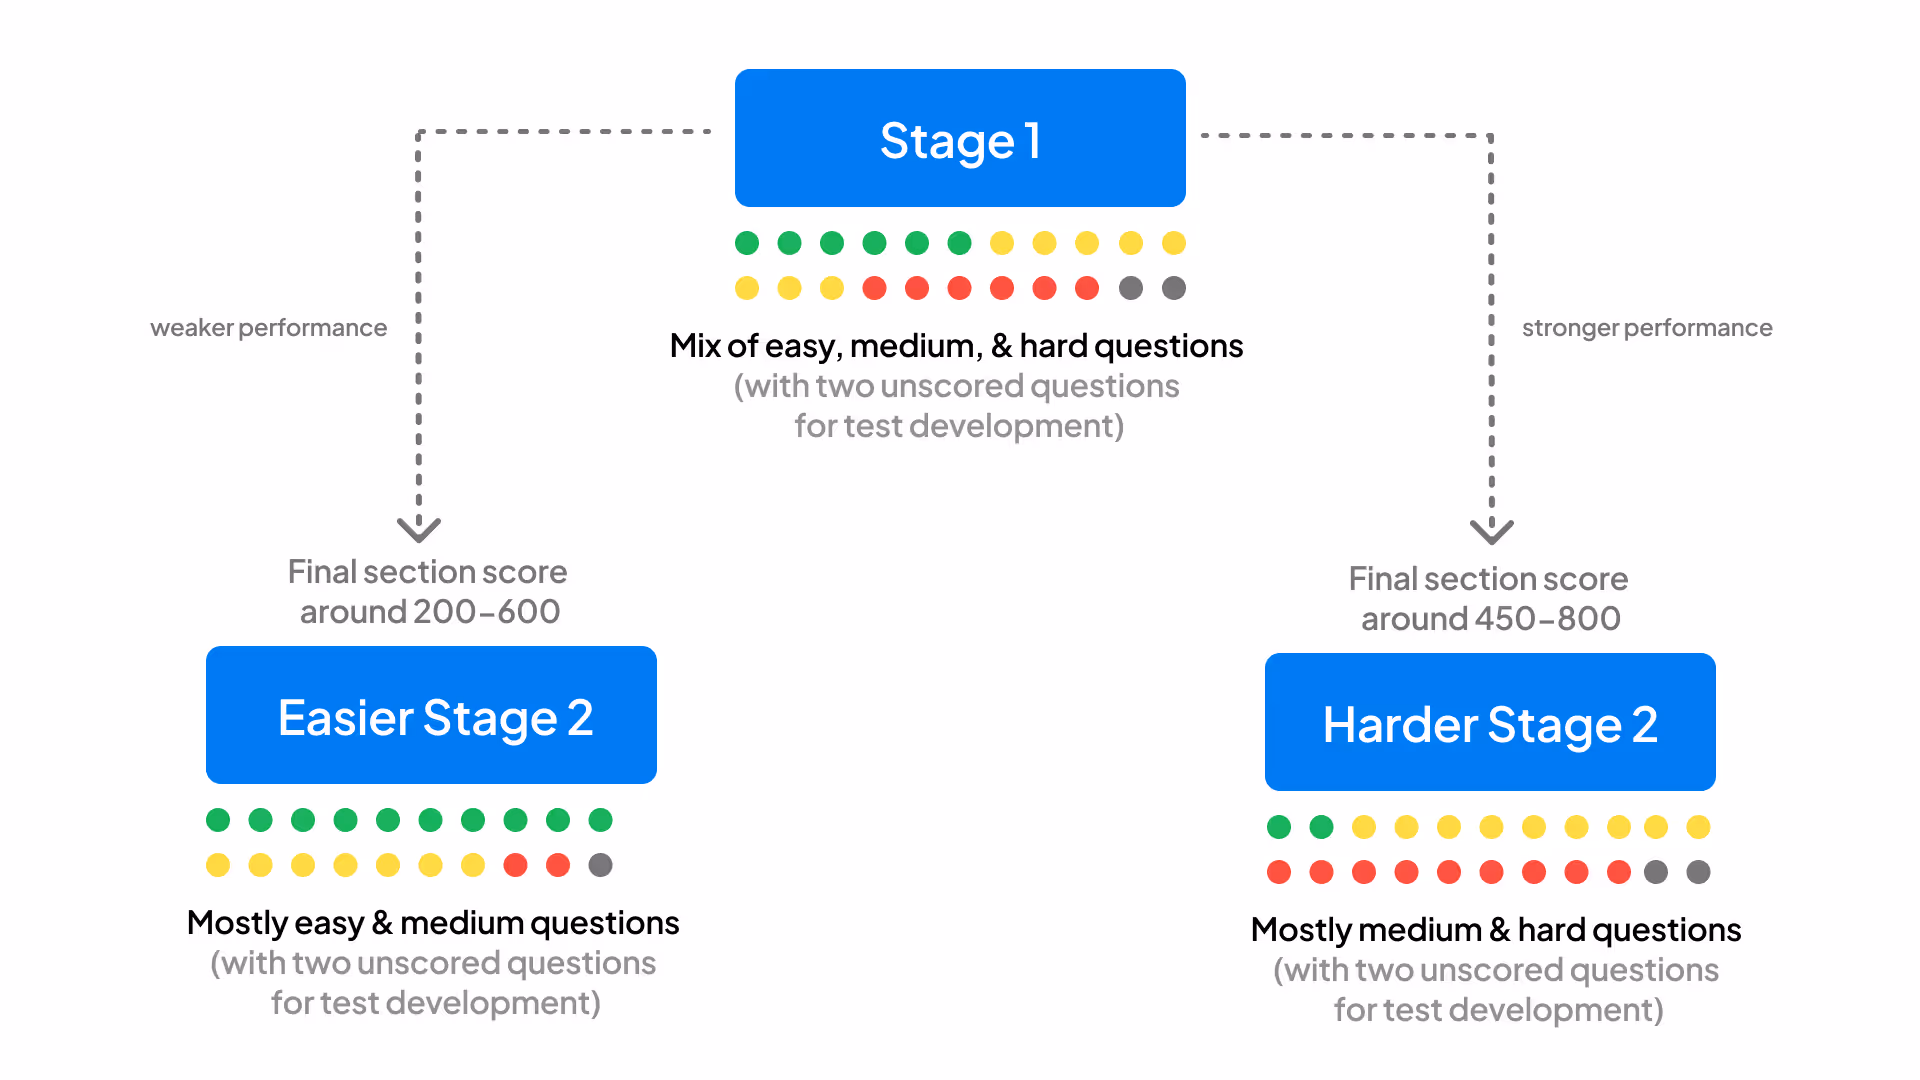
These practice tests give us our first glimpse of the adaptive algorithm that the College Board will use for scoring the new tests. In the first module (a.k.a the baseline module), students will face a mix of easy, medium and difficult questions. Based on how students perform on the first module, the second module (a.k.a the adaptive module) of questions will be harder or less hard. The student's performance on the first module for math and reading & writing will determine whether one gets the easier or harder adaptive modules as their second module in each section. With 22 math questions (20 operational, 2 experimental/pretest questions (non-graded)) and 27 Reading/Writing questions (25 operational, 2 experimental (non-graded)) in each baseline module, what will be the cut-off to decide on the easier or harder difficulty level for their second module?
Current industry estimates suggest the cutoff to advance to the harder module is roughly 60% on Math (around 13 of 22 correct on the baseline) and around 70% on Reading & Writing (around 19 of 27 correct on the baseline). These thresholds are estimates based on multiple practice test analyses across providers and may vary by test form. The early Bluebook practice test analysis suggested slightly higher cutoffs (15 of 22 for Math, 18 of 27 for R&W), but the broader consensus has shifted with more test data available.
That would indicate that a student must answer roughly two-thirds of the questions correctly to get the harder module in their second. ot factor in the 2 experimental questions per module, which will not impact the algorithm.
Digital SAT Adaptive Structure
2. What's the Cutoff Score to Get the Hard Module?
We have more work to do to fully understand the nature of the scoring algorithm once Reading & Writingmore tests are released, but our initial analysis begins to reveal some of the "edges" of the scoring.
EdisonOS Scaled Score Capping: EdisonOS’s scoring engine applies the same module-routing and scaled score capping logic the real SAT uses, so practice test scores accurately reflect where a student would land on the real exam, including the ceiling effects from being routed to the easier Module 2.
Easy Module vs Hard Module: What Actually Changes
If you're routed to the easier Module 2, the questions aren't simpler in topic, they cover the same domains as the hard module. What changes is the difficulty progression and the score weight per question.
Three things differ between easy and hard Module 2:
Question difficulty mix: The easy Module 2 has mostly easy and medium questions, very few hard ones. The hard Module 2 has very few easy questions and a larger share of hard and very-hard questions.
Per-question scoring weight: Hard questions in the hard Module 2 carry more weight per correct answer, which means even one extra correct answer in the hard module is worth more than one in the easy module.
Scoring ceiling: The easy Module 2 has a hard cap on the section score — roughly the high 500s to low 600s, depending on Module 1 performance. The hard Module 2 has access to the full 800 ceiling.
In practical terms: a student who answers 18 of 22 questions correctly in the hard Module 2 will outscore a student who answers 22 of 22 correctly in the easy Module 2. The difficulty mix matters more than raw accuracy when it comes to your final section score.
3. The Easy Upper Limit
In the Math module, if a student misses more than 7 questions on the baseline math module and is therefore routed to the easier adaptive module, that student's final score appears to be capped at 650 or so. Even if a student answers all 22 questions correctly in the adaptive module (20 of which are operational, 2 experimental), the missed questions from the baseline will cap the score to 650.
4. The Hard Lower Limit
If a student correctly answers the minimum threshold of 15 questions on the baseline module to advance to the harder subsequent math module and then proceeds to miss every question in the second module, that student will attain a score of 460. So it seems the scoring minimum for a student advancing to the hard math module is roughly 460 (15 of 44 total items answered correctly), and the maximum score for a student advancing to the easier math module is approximately 650 (36 of 44 items answered correctly). It is important to mention that this scale will likely be distinct for this practice test and not generalize to subsequent tests, which will have their scales. The threshold to advance in math maybe 14 or 16 questions, but this early analysis gives students a ballpark estimate of how they will have to perform to cross the threshold to the more difficult adaptive sections.
The digital version of the SAT comes with several critical tools to ensure all students are equipped to succeed.
An onscreen timer will ensure more accurate and consistent timing. Students no longer need to rely on a proctor to time them correctly or worry about bringing the right type of watch on test day.
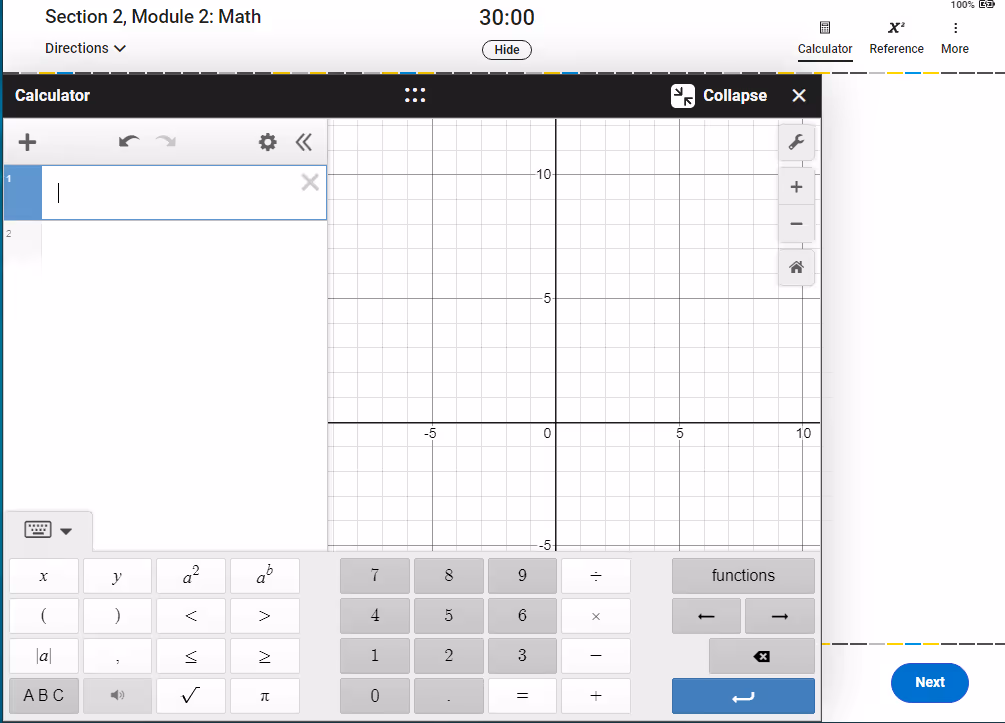
2. In-App Calculator
The powerful Desmos graphing calculator, baked into the app, plays a major role in this new test and, for many students, will fundamentally change the experience of taking the test. A graphing calculator is built into the testing app, ensuring everyone has access to the same functionalities. The calculator opens and closes with a single click and can remain open throughout the test. While some students feel more comfortable with their familiar handheld calculator, the Desmos option is right on the screen, immediately adjacent to the content, which is extremely convenient for problem-solving.
We found that students who know how to use a graphing calculator could use it to answer the majority of questions, often by plugging in equations and identifying where functions intersect on the graph. While there may be more efficient ways to solve every problem, it affords students another pathway towards the correct answer and can significantly help low and mid-scoring students. In particular, the Desmos calculator made the "easier" adaptive module that much easier for students: the calculator was a passport to solving a surprising number of problems.
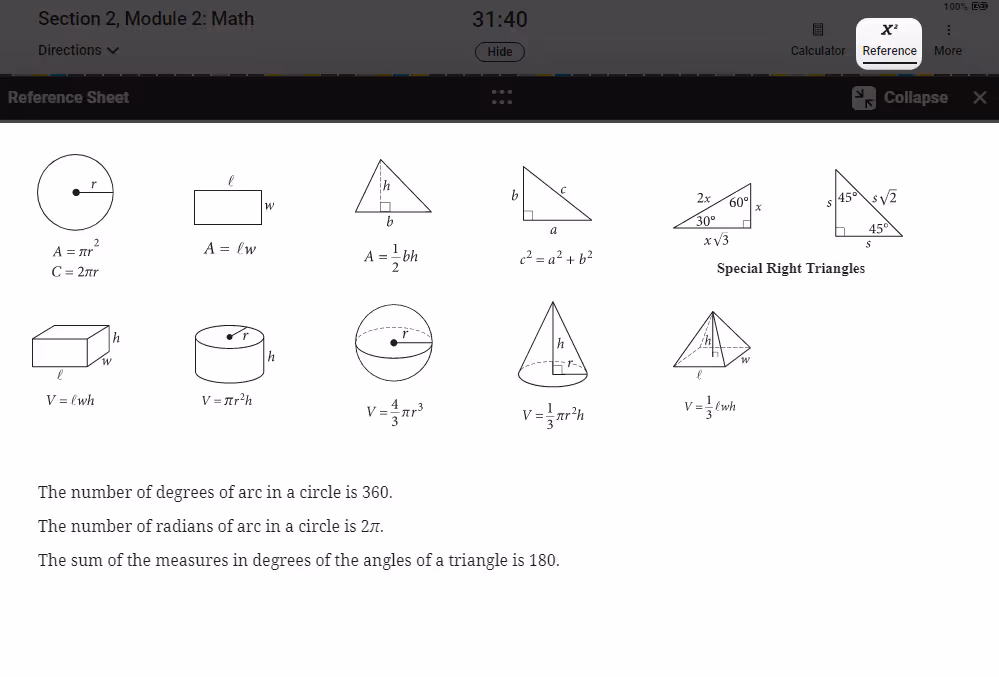
3. Reference Sheet
The same math reference sheet that used to appear in the opening pages of the paper SAT is available on the digital SAT.
4. Elimination Function
By toggling the elimination button in the top right corner of the question, students can visually eliminate answers that are obviously wrong and hone in on the top contenders.
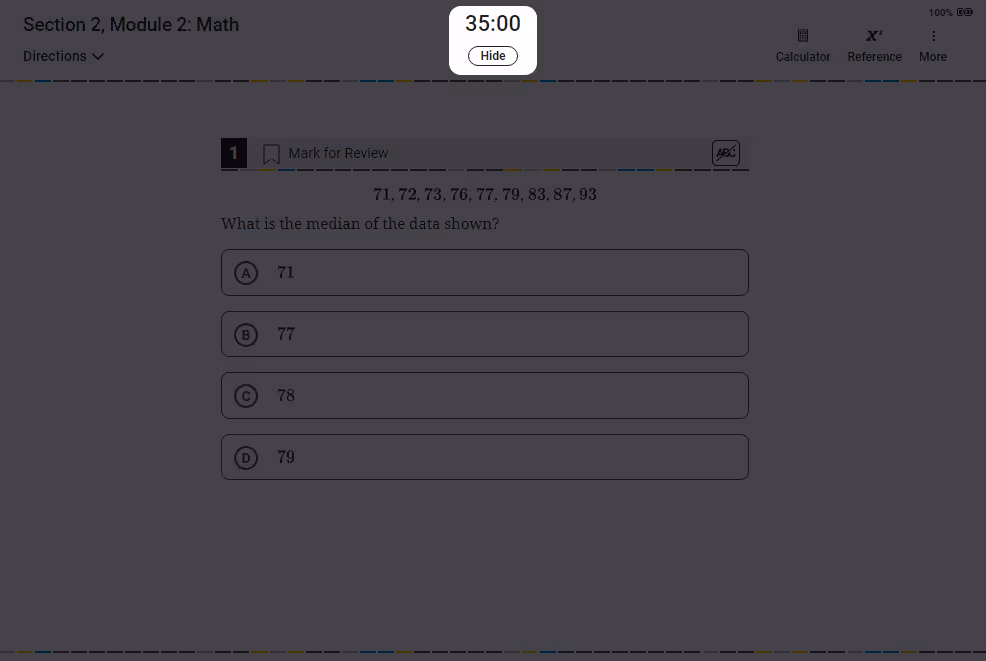
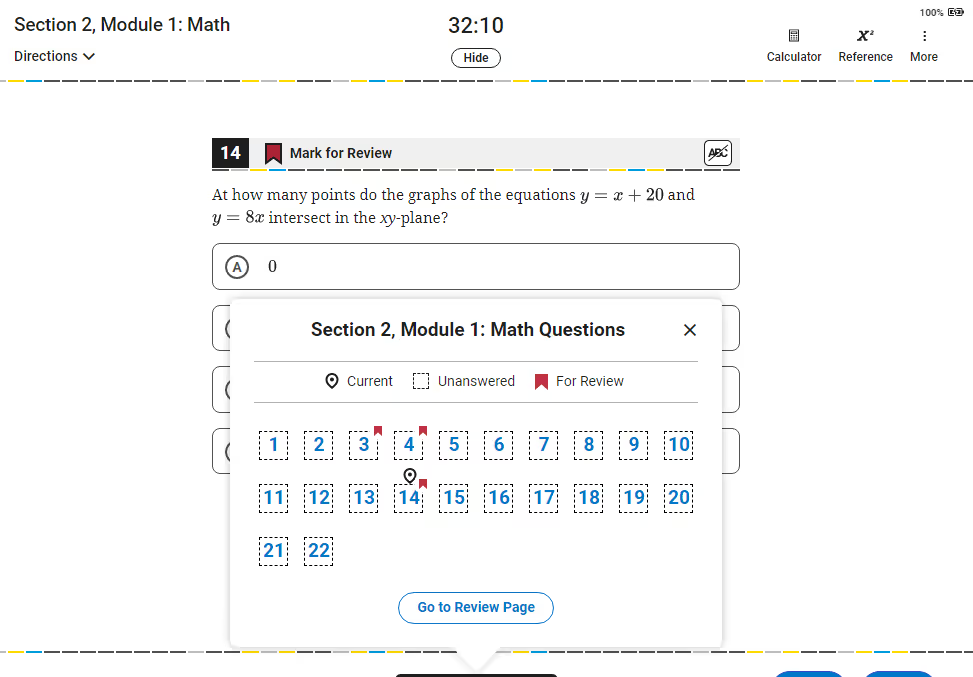
5. Mark for Review Function
Are you nervous that you can't draw stars next to questions you want to return to? Never fear. The digital SAT includes a "mark for review" feature, allowing students to flag questions they wish to review later and easily navigate back to these questions.
Consolidated mark for review view at the end of each module. This feature helps you go through all the questions marked for review in a single window and navigate easily through each marked question.
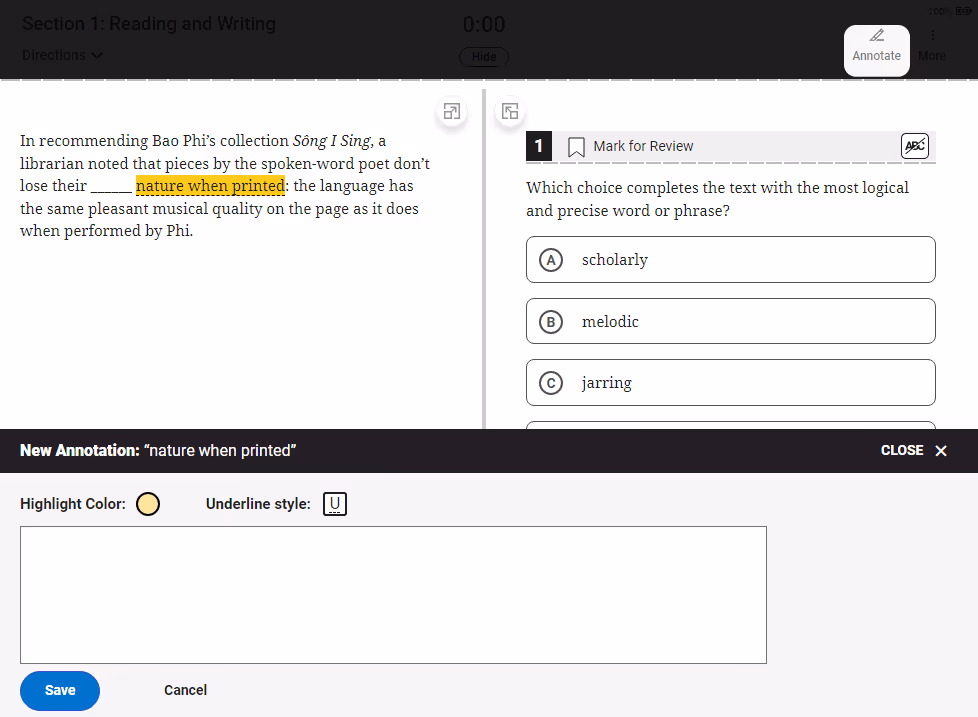
6. Annotate Function
Some students like to jot down notes next to Verbal questions on the pen & paper SAT. On the digital SAT, there's an "Annotate" button to preserve that capability, allowing students to write quick notes to themselves about the main ideas, keywords, or phrases.
EdisonOS Authentic Digital SAT Interface: EdisonOS’s practice interface includes all six built-in tools - Desmos calculator, digital timer, annotation, mark for review, elimination, and reference sheet, mirroring the official Bluebook experience. Students who practice in this environment arrive on test day without interface anxiety. Try the free digital SAT practice test to see the interface firsthand.
Conclusion
The digital SAT is an important development in the world of standardised testing. As SAT continues to transition into the online space, it is important for students and educators to familiarise themselves with the digital format and understand its unique features and potential challenges. By preparing in advance, reviewing test day essentials, and understanding the differences between the digital and traditional versions of the SAT and how to calculate the digital SAT score, students can ensure that they are well-equipped to succeed on the test and achieve their academic goals.
Disclaimer: Please note that the content is structured around the SAT practice test, attempted on College Board.
How EdisonOS Empowers Tutors for Digital SAT Success
EdisonOS is a purpose-built Digital SAT platform designed for tutors to craft high-quality practice tests, simulate the official exam environment closely aligned with the Bluebook testing guide, and access powerful student performance analytics.
The platform helps tutors boost student scores by 200+ points with access to 5000+ preeminent SAT experts-vetted questions and 22 expert-designed adaptive tests. Tutors can build their own practice tests that mimic the real test-taking experience in under 60 minutes, bridging the gap between the practice SAT and the real SAT, allowing them to customize assessments based on each student's needs and target weak areas efficiently.
Build Your Own Test (BYOT): Tutors can build a custom Module 1 simulation in under 15 minutes using EdisonOS’s 6,000+ question library. Instead of stitching together questions from PDFs, tutors get a Bluebook-style practice test ready to assign in minutes, ideal for module-routing practice drills.
By combining authentic test simulation with powerful analytics and flexible test creation, EdisonOS gives tutors everything they need to help students navigate the complexities of Digital SAT scoring and achieve their target scores.
What is the difference between the digital SAT and the paper-and-pencil test?
What is included in the Math section of the digital SAT?
What is included in the Reading and Writing section of the digital SAT?
Is Digital SAT harder than SAT?
What is the digital SAT?
ABOUT THE AUTHOR
Deepak Murugaian
CEO & Founder
Deepak brings over a decade of EdTech experience, specializing in blending technology with education. His collaborations span educators, schools, and educational organizations, fostering tech advancements. He earned a Master's in Artificial Intelligence from Heriot-Watt University, showcasing his technical expertise.
Tutors Edge by EdisonOS
Get Exclusive test insights and updates in our newsletter, curated to help tutors stay ahead!
Thanks for subscribing! The 'Digital SAT Breakdown Report' has reached your inbox!
Oops! Something went wrong while submitting the form.


.png)


.png)
.webp)
