

Key Takeaways
- PSAT scores provide benchmarks but not exact SAT predictions.
- Conversions highlight readiness and guide realistic target-setting.
- Use PSAT results to build focused, personalized prep plans.
If you’re tutoring students for the SAT, one of the first questions you’ll face is: How do I use PSAT scores to predict their SAT performance?
The PSAT plays a critical role in shaping SAT prep. While it doesn’t count for college admissions, it provides the clearest early signal of a student’s readiness for the SAT. Parents and students often misinterpret those numbers, but PSAT results can also act as benchmarks that help set targets and map out prep.
That’s why understanding PSAT-to-SAT conversion is essential. It shows you how today’s PSAT performance might translate into future SAT results, where gaps exist, and what kind of score growth is realistic. But conversions shift slightly based on test difficulty, adaptive scoring, and student progress between sittings.
However, rather than viewing converted PSAT scores as SAT predictions, you should treat them as baseline assessments. Use these results to map out personalized study plans, focusing preparation time on the sections and question types where students struggled most on the PSAT.
In this guide, we’ll break down everything you need as a tutor: how the PSAT and SAT scoring scales compare, the official conversion chart, why those numbers fluctuate, and how to turn raw PSAT data into actionable lesson plans using platforms like EdisonOS that keep students motivated and parents confident.
Is the PSAT similar to the SAT?
Yes, but with the differences you should highlight. Both tests measure critical reading, writing, and math skills. The PSAT leans more on foundational concepts, while the SAT pushes into advanced reasoning.
Further, the PSAT comes in three versions designed for different grade levels:
- PSAT 8/9: Taken by students in eighth and ninth grade, testing the same skills as the other PSAT exams but adjusted to their level, and it helps set a baseline for future growth.
- PSAT 10 and the PSAT/NMSQT: These are essentially the same test in content and difficulty. The difference lies in timing and purpose: 10th graders usually take the PSAT 10 in the spring, while 11th graders (and some 10th graders) sit for the PSAT/NMSQT in October.
- PSAT/NMSQT: Only this counts as the qualifying exam for the National Merit Scholarship Program—scores from the PSAT 10 or PSAT 8/9 are not considered for that competition.
PSAT vs. SAT at a glance
Understanding PSAT and SAT scoring scales
The PSAT has a total score range of 320–1520, while the SAT ranges from 400–1600. Both exams are divided into two main sections—Evidence-Based Reading and Writing (EBRW) and Math. On the PSAT, each section is scored between 160–760, while on the SAT, it’s 200–800.
The PSAT and SAT share a common scale, but the relationship is not proportional. The College Board uses statistical concordance, which produces uneven jumps and plateaus at certain score ranges.
While PSAT scores can predict SAT readiness, they are not guarantees. A student who scores 1200 on the PSAT is likely on track for around a 1300 on the SAT, but improvements (or setbacks) depend on preparation, test-day performance, and growth in higher-level skills.
How PSAT scores translate to SAT scores
The PSAT and SAT don’t connect through a simple conversion. Instead, the College Board uses “statistical concordance,” which estimates how a PSAT score might translate to the SAT if the tests were taken on the same day. A 1300 on the PSAT doesn’t ensure a 1300 on the SAT—it just shows roughly the same level of academic strength at that point in time.
Both tests share a common scale, so a score has the same meaning in terms of ability. But the SAT goes further, especially in math, which is why PSAT scores top out at 1520 instead of 1600.
This makes the PSAT more of a predictor than a final measure. It highlights where students are now and where they may land with more practice.
PSAT to SAT conversion chart
You can use the following chart to gauge how much preparation students may need for the SAT. Keep in mind, though, that their PSAT score won’t always match their SAT score.
Note: This applies only to PSAT/NMSQT scores, not PSAT 8/9 or PSAT 10.
Use this chart to estimate where your students stand. At the same time, emphasize that scores don’t map perfectly—growth between PSAT and SAT is common with effective prep.
Factors that affect conversion accuracy
PSAT-to-SAT conversions are a helpful starting point, but they’re not guarantees. The SAT measures a little more, and the way students perform can vary from test to test. Knowing what affects conversion accuracy helps you treat the PSAT as a guide.
Adaptive nature of digital tests
The SAT is now fully digital and adaptive, while the PSAT is still in transition. On the digital SAT, the difficulty of later questions adjusts based on how a student performs in earlier sections. This adaptive design can push scores higher or lower depending on test-day performance. Since the PSAT doesn’t yet mirror this format completely, conversions can’t always capture how a student might perform under the adaptive model.
Student performance fluctuations
Scores don’t just depend on ability—they also reflect how a student performs on a specific day. Some students thrive under pressure, while others struggle with timing or nerves. Even a single round of focused prep between the PSAT and SAT can significantly shift results. That variability makes it hard to assume a one-to-one score match.
Differences in difficulty and question distribution
Although the PSAT and SAT measure the same core skills, the SAT goes further, especially in math and reading. The SAT includes slightly more advanced concepts and has a different balance of question types. These shifts mean a strong PSAT performance doesn’t always translate directly to an identical SAT score—it highlights readiness, but not the final outcome.
Using PSAT scores to guide SAT prep
PSAT results provide a strong starting point, helping students estimate their SAT range and identify areas that need improvement. You can use PSAT results to:
- Pinpoint weak areas. For example, if a student misses multiple grammar questions about subject-verb agreement, that’s your cue to spend time drilling those rules. Or if they lose points in algebra but ace geometry, you know where to focus your next few sessions.
- Set realistic SAT target scores. Map PSAT results against desired college benchmarks. The PSAT score helps you estimate an SAT range. For example, a student scoring 1150 on the PSAT typically converts to around 1260 on the SAT. If they're targeting a college with an average admitted SAT score of 1350, the realistic improvement goal is approximately 90 points—achievable with focused preparation but requiring sustained effort over several months.
- Structure lesson plans around gaps revealed in PSAT results. If a student is already strong in reading comprehension but weaker in math, you can adjust your sessions accordingly—maybe 70% math drills, 30% reading/writing practice. This way, you won’t waste time reteaching what they already know.
How EdisonOS supports score analysis and conversion
EdisonOS equips you with detailed analytics and customizable tools that make it easier to interpret scores and guide students toward their target ranges. Here’s an overview of the features that can help you streamline your students’ PSAT prep:
Growth tracking and analytics
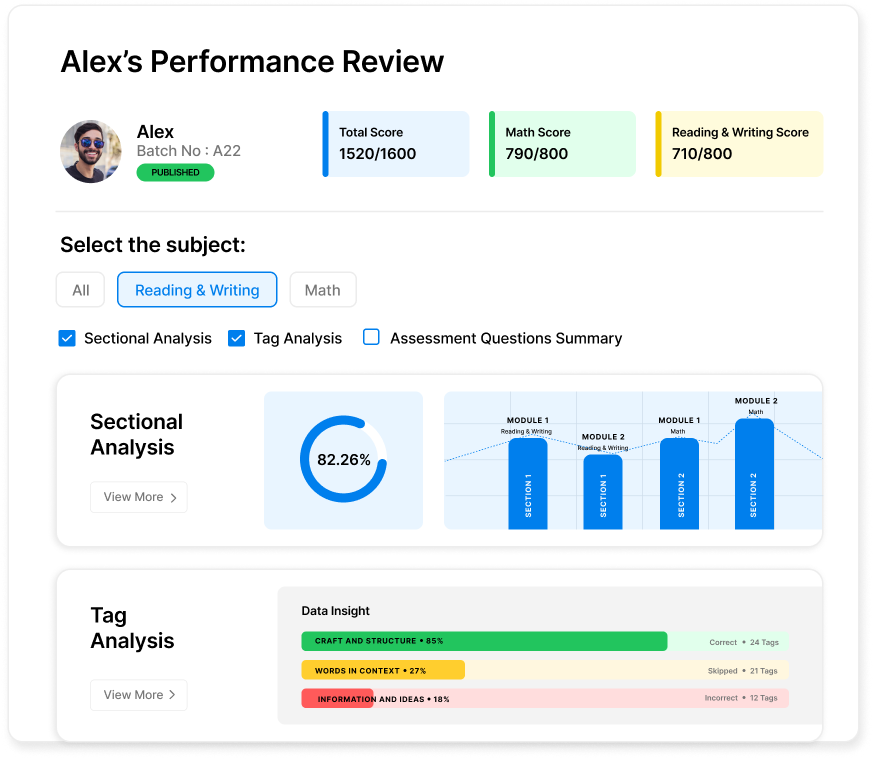
Track every student’s journey from diagnostic test to full prep with real-time score calculator tools. The platform logs performance, highlights weak areas, and shows trends.

Loaded question bank & Build Your Own Tests (BYOT)
Access 5,000+ expert-vetted questions and 22 adaptive tests, or create realistic practice tests in under an hour that mimic the official digital PSAT experience.
Identify areas of improvement
Use detailed performance breakdowns to pinpoint gaps—whether it’s grammar precision, math reasoning, or pacing—and set measurable goals.

Curriculum builder for personalized study plans
Turn raw performance data into step-by-step prep plans. Assign targeted lessons, track progress, and adjust timelines as students advance.

The bottom line
PSAT scores provide valuable insights into SAT readiness when interpreted correctly. Conversion charts can give helpful estimates, but they don’t promise outcomes. Real success comes from using PSAT results to pinpoint skill gaps, build targeted study plans, and track progress over time.
Use tools like EdisonOS to run accurate PSAT-to-SAT score conversions, visualize growth, and design personalized prep plans that keep both students and parents motivated. With the right approach, PSAT results become a launchpad for SAT success.
Recommended Reads
Recommended Podcasts


.png)


.png)
.webp)
