All Blogs

By
Mayank Batavia
7 minutes
Read
Updated on
May 1, 2026
PSAT Score Report: All You Need To Know
Understand PSAT score reports, benchmarks, and percentiles to identify strengths, guide SAT prep, and avoid common mistakes.
Start Free Trial


The PSAT score report not only shows the student’s current performance but also strongly indicates their likely score in the actual SAT. That way, it becomes a kind of a beacon for the students' SAT prep journey.
It uncovers the areas the student is good - or bad - at, which will help the student make a better decision about their careers. That way, tutors and counselors can see a lot more than what’s on the PSAT score report.
In this article, we will see what all things figure on the PSAT score report, discuss the score ranges, and the benchmarks. We’ll also look at how to use the score card, how to spot the student’s strengths and weaknesses based on the scores, and what mistakes to avoid. But first, we’ll talk about how and when the students can get their PSAT scores.
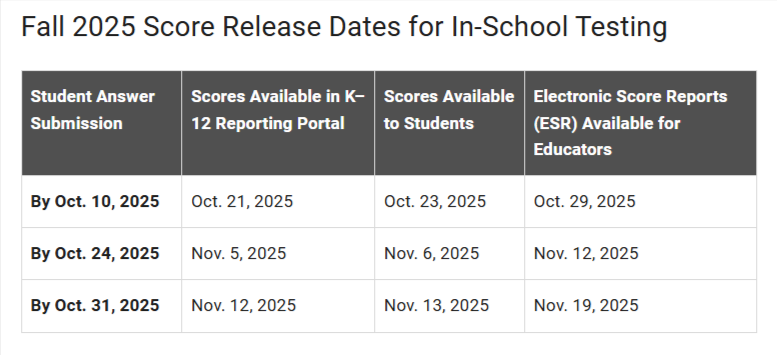
The College Board says they make available the PSAT/NMSQT scores approximately four to six weeks after the test dates. However, they may be available online earlier - typically accessible between two and four weeks after the test dates. For instance, for answers submitted by October 24, 2025, the scores are available on the K-12 portal by November 5, 2025, to the students by November 6, 2025, and the ESR (Electronic Score Reports) are available to educators by November 12, 2025.
As a tutor,you want to let parents and students know these dates, so that they can access the scores in time too.
Your students may access their PSAT/NMSQT, PSAT 10, or PSAT 8/9 scores in two different ways:
There are two sections on the PSAT: Reading and Writing (RW), and Math (M). The report card mentions scores of each of these two sections as well as the total score of the entire test. The total score is simply the addition of the two sectional scores.
The total score is a three-digit number that falls between 320 and 1,520 points.
The PSATmaintains what is called a common score scale (or continuous score scale) with the SAT. That means whatever a student scores on the PSAT for a particular section is an accurate representation of their likely score on the actual SAT, had they taken the SAT on that particular day.
For example, if Malcolm scored 480 in Reading and Writing (RW) in the PSAT, he would have scored 480 in Reading and Writing (RW) on the SAT, had he taken the SAT on the same day.
The common score scale also accepts growth the same way. If Malcolm scored 480 in RW on the PSAT/NMSQT last year and scores 540 in the RW on the SAT this year, his score is said to have grown by 60 points.
Each section has a score range of 160 to 760 points. Within the Evidence-Based Reading & Writing (RW) section, the PSAT evaluates four domains. The skills tested and their percentage distribution is shown in the adjoining table:
Similarly, within the Math section, the PSAT evaluates four domains. The topics tested and their percentage distribution is shown in the adjoining table:
PSAT-reading-and-writing-domains
The four domains and their weight in PSAT Reading and Writing
Similarly, within the Math section, the PSAT evaluates four domains. The topics tested and their percentage distribution is shown in the adjoining table:
PSAT-math-domains
The four domains and their weight in PSAT Math section
For instance, in the adjoining screenshot, the student has performed better under Information and Ideas as compared to Craft and Structure. The same student has performed the best in Geometry & Trigonometry in the Math section, but the least in Advanced Math.
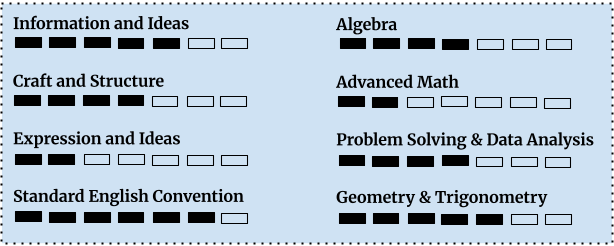
The domain-wise performance is a great way of understanding what areas the student is good at and - more importantly - what areas do they need additional practice.
In the image showing domain-wise performance, you would have noticed Malcolm has performed his lowest in Expression and Ideas. That means when he begins his SAT preparations, he will need to pay more attention to questions of these type.
The PSAT sectional scores don’t just measure the competence of the student across domains, they go a step further. It sets a threshold which shows the extent to which the student is ready for college in due course.
Both the sections have individual thresholds called PSAT benchmarks. This benchmark is nothing but a score.
The PSAT Benchmarks
PSAT-benchmarks
PSAT Benchmarks for Grade 10 and 11
So how do you interpret these benchmarks?
Let us say Maya, a Grade 10 student, scored 440 in R&W and 460 points in Math in the PSAT. It’s obvious that her score for R&W is above the benchmark but her Math score is below the benchmark.
So if Maya were to continue her current efforts, she’d be college-ready with R&W skills when she takes the actual SAT. However, because she failed to clear the Math benchmark, her current effort won’t suffice and she’ll need extra work in order to be college-ready.
Educators, parents, and students can use these benchmarks to identify specific challenges and create personalized study plans. If a student hasn’t cleared the benchmarks, the study plan will help ensure they at least reach the cutoff. If, on the other hand, the student has met or exceeded the benchmark, the study plan can make further improvements.
Several other things appear on the PSAT score report, so it’s important that you, as a tutor, can explain how to read the PSAT score report to the parents in detail. Here are the key features:
The College Board believes that “a student’s ability is better represented by score ranges than points”.
Just below each of the sectional scores and the total scores, you’ll see something called a Score Range. For instance, the PSAT score report of a student whose R&W score is 620 might show a score range 590-650 for that section. It means the student’s score would have fallen between 590 and 650, had the student taken the SAT under a different administration.
These ranges are a reflection of the deviation or standard error of measurement of the test, according to the testing authorities.
In addition to the Score Range, you’ll also see the 3-year average for each section as well as the total score. As the name suggests, it is the average score achieved by all those who took the test in the past three years. Remember the average scores are across all grades.
This average is a good indicator of how students have performed over the past three years. You can use this to give a reality check to your students if they are feeling too low or excessively confident.
In addition to the scores, the PSAT provides you what is known as a percentile score. It is a better indicator of the student’s performance as compared to the rest of the test-takers. Let’s examine it.
The percentile score of a student is the percentage of test-takers that scored equal to or less than the student.
It will be easier to understand this with the help of an example. Look at the score card in the adjoining image. You will notice that next to the total score of 1,240, there’s a number “81st”. This means that out of all the students that took the PSAT in the past three years, 81 percent of the total test-takers scored equal to or less than 1,240.
You will notice similar numbers with R&W sectional scores (60th) and Math sectional scores (65th).
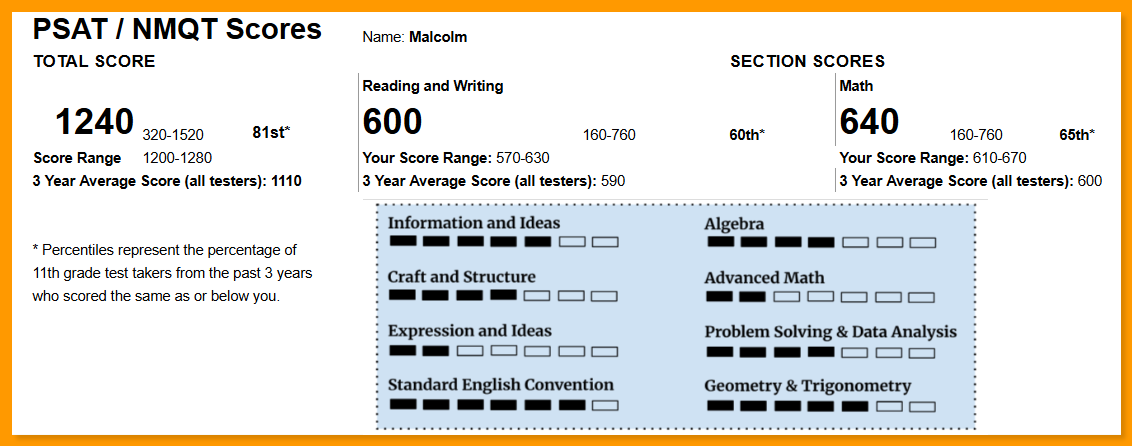
Put differently, out of every 100 test-takers, 81 students scored equal to or below than Malcolm. For the R&W section, this number was 60, while for Math this number was 65.
The two are significantly different. Percentiles represent comparative performance while raw score simply stands for the number of correct answers and is an absolute performance.
Percentiles can only be arrived at by knowing the performance of all the students who took the test. Raw score, on the other hand, needs no such information. That means percentiles represent the performance of a particular student as compared to the entire group of test-takers and is a great indicator of how well (or how poorly) the student performed.
Let us consider a hypothetical case. Imagine that the next October, the testing authorities make the R&W section exceptionally challenging. As a result, Malcolm’s raw score is just 10. However, everybody who takes the PSAT finds it equally difficult and everyone receives a low raw score.
Since everyone received a low raw score, the performance of Malcolm, relative to the rest of the test-takers doesn’t change. So he will still get a high percentile score.
On the whole, percentiles are a strong indicator of a student’s performance among all the test-takers, but the raw score isn’t.
Percentiles and benchmarks are important indicators of how the student has performed, but they mean different things.
As we just mentioned, percentiles represent a student’s performance vis-a-vis that of the rest of the students. Percentile shows the student’s standing among other students, but doesn’t directly relate to anything else.
Benchmark, on the other hand, is a standard of college-readiness. If the student’s score equals or exceeds the benchmark, it means that the student is on track in skilling themselves for the requirements of a college. Hence, PSAT benchmarks are an academic indicator.
Parents may need a detailed explanation about what percentiles mean. Firstly, explain that bigger the number, better the performance of the student. Next, tell them it’s a way to show the student’s test result on a scale of hundred. Finally, clarify that if there were only 100 students in the PSAT, the percentiles would show how many students are behind the student in terms of scores.
A converse, but less common, way of explaining is this: deduct the percentiles from 100 and the result you get is the rank of the student out of every 100. In the example we mentioned earlier, Malcolm scored 81 percentile. Deducting 81 from 100 gives 19, which suggests that out of 100 test-takers, Malcolm stood at the 19th position from the top.
Once you know what’s on the PSAT score report, it’s important to know how to use those numbers. Here’s how your pupils and you can use the scores:
In a year or two after taking the PSAT, your students will be writing the SAT. There are five ways students can use the PSAT scores:
The digital PSAT score report is a great tool for tutors to shape their students’ SAT prep journey. Here’s how:
Because of its digital nature, the PSAT test (and the scores) reveal a great deal more than simply numbers.
Here are the three key things that stand out with the digital version and reporting
It’s not unusual for students and parents to misinterpret the PSAT scores. That’s where you, as a seasoned tutor, can step in and help them avoid the common mistakes.
In many ways, the PSAT score report reflects what Bernardo Villalobos, the choir director in the Oscar-winning movie CODA (2021) says,”I can't do my job unless you do yours”. The score is a strong indicator of the future SAT scores, but there’s a lot of work involved on the way.
Students need to treat the scores as a tool to build the roadmap for the test prep journey. A committed tutor, with the help of a powerful digital platform, can transform the lives of disciplined students by leveraging score insights.
As the top choice of tutors and over 14,000 students, EdisonOS can scale and transform the way how students navigate from PSAT to SAT. Why not speak to one of the experts at EdisonOS to learn more?


The EdisonOS Newsletter
One essential monthly read for college readiness educators


.png)
.webp)

.png)