PSAT to SAT Score Conversion: A Practical Guide for Tutors
Use this PSAT to SAT conversion chart (2025–2026) to predict SAT scores, understand section-level differences, and build targeted prep plans. A guide for tutors.
PSAT scores provide benchmarks but not exact SAT predictions.
Conversions highlight readiness and guide realistic target-setting.
Use PSAT results to build focused, personalized prep plans.
If you’re tutoring students for the SAT, one of the first questions you’ll face is: How do I use PSAT scores to predict their SAT performance?
The PSAT plays a critical role in shaping SAT prep. While it doesn’t count for college admissions, it provides the clearest early signal of a student’s readiness for the SAT. Parents and students often misinterpret those numbers, but PSAT results can also act as benchmarks that help set targets and map out prep.
hat’s why understanding PSAT-to-SAT conversion is essential. It shows you how today’s PSAT performance might translate into future SAT results, where gaps exist, and what kind of score growth is realistic. But conversions shift slightly based on test difficulty, adaptive scoring, and student progress between sittings.
However, rather than viewing converted PSAT scores as SAT predictions, you should treat them as baseline assessments. Use these results to map out personalized study plans, focusing preparation time on the sections and question types where students struggled most on the PSAT.
In this guide, we’ll break down everything you need as a tutor: how the PSAT and SAT scoring scales compare, the official conversion chart, why those numbers fluctuate, and how to turn raw PSAT data into actionable lesson plans using platforms like EdisonOS that keep students motivated and parents confident.
Is the PSAT similar to the SAT?
Yes, but with the differences you should highlight. Both tests measure critical reading, writing, and math skills. The PSAT leans more on foundational concepts, while the SAT pushes into advanced reasoning.
Further, the PSAT comes in three versions designed for different grade levels:
PSAT 8/9: Taken by students in eighth and ninth grade, testing the same skills as the other PSAT exams but adjusted to their level, and it helps set a baseline for future growth.
PSAT 10 and the PSAT/NMSQT: These are essentially the same test in content and difficulty. The difference lies in timing and purpose: 10th graders usually take the PSAT 10 in the spring, while 11th graders (and some 10th graders) sit for the PSAT/NMSQT in October.
PSAT/NMSQT: Only this counts as the qualifying exam for the National Merit Scholarship Program—scores from the PSAT 10 or PSAT 8/9 are not considered for that competition.
This would also be a good place to ask the question ‘what has changed in the PSAT’. That’s because every small change counts.
PSAT vs. SAT at a glance
Feature
PSAT 8/9
PSAT 10
PSAT/NMSQT
Timing & Length
2 hrs 25 min
2 hrs 45 min (spring)
2 hrs 45 min (October)
Scoring
240–1440 total (120–720 per section)
320–1520 total (160–760 per section)
320–1520 total (160–760 per section)
Purpose
Establishes a baseline for college readiness
Practice test and progress check for 10th graders
Practice test and qualifier for National Merit® Scholarship
Availability
Fall, set by schools
Spring, set by schools
October only
Who Sees Your Scores
School, district/state, parents (not colleges)
School, district/state, parents (not colleges)
School, district/state, parents, and National Merit Scholarship Corporation (not colleges)
Role in Scholarships
Not considered
Not considered
Qualifying test for National Merit® Scholarship Program
PSAT 8/9 to SAT Conversion: What the Score Range Difference Means
Let’s begin with the most important part: PSAT 8/9 scores are not covered under the above chart. That conversion is only for the PSAT/NMSQT. And the reason is simple - the PSAT 8/9 is for younger students. That’s why the score ranges can’t fully align.
The PSAT 8/9 scores range from 240 to 1440, while those of the SAT range from 400 to 1600. The sectional ranges are as below.
Test
Minimum Sectional Scores
Maximum Sectional Scores
Minimum Total
Scores
Maximum Total
Scores
PSAT 8/9
120
720
240
1440
SAT
400
800
800
1,600
The main reason behind this difference is that the PSAT 8/9 tests less advanced concepts. The SAT evaluates a student’s college-readiness while the PSAT 8/9 is meant for younger students.
Yet, the PSAT 8/9 scores provide one of the best estimations of your SAT scores, since PSAT 8/9 is a kind of a precursor to the SAT.
Understanding PSAT and SAT Scoring Scales
The PSAT has a total score range of 320–1520, while the SAT ranges from 400–1600. Both exams are divided into two main sections—Evidence-Based Reading and Writing (EBRW) and Math. On the PSAT, each section is scored between 160–760, while on the SAT, it’s 200–800.
The PSAT and SAT share a common scale, but the relationship is not proportional. The College Board uses statistical concordance, which produces uneven jumps and plateaus at certain score ranges.
While PSAT scores can predict SAT readiness, they are not guarantees. A student who scores 1200 on the PSAT is likely on track for around a 1300 on the SAT, but improvements (or setbacks) depend on preparation, test-day performance, and growth in higher-level skills. Read: Is the SAT Curved? The Digital SAT Curve and Equating Explained
How PSAT Scores Translate to SAT Scores
The PSAT and SAT don’t connect through a simple conversion. Instead, the College Board uses “statistical concordance,” which estimates how a PSAT score might translate to the SAT if the tests were taken on the same day. A 1300 on the PSAT doesn’t ensure a 1300 on the SAT—it just shows roughly the same level of academic strength at that point in time.
Both tests share a common scale, so a score has the same meaning in terms of ability. But the SAT goes further, especially in math, which is why PSAT scores top out at 1520 instead of 1600.
This makes the PSAT more of a predictor than a final measure. It highlights where students are now and where they may land with more practice.
PSAT to SAT Conversion Chart
You can use the following chart to gauge how much preparation students may need for the SAT. Keep in mind, though, that their PSAT score won’t always match their SAT score. It’s used to show what scores a student would likely receive if they continue working on similar lines.
Note: This applies only to PSAT/NMSQT scores, not PSAT 8/9 or PSAT 10.
PSAT Score
Converted SAT Score
PSAT Score
Converted SAT Score
400
630
1010
1140
410
640
1020
1150
420
650
1030
1160
430
650
1040
1170
440
660
1050
1180
450
670
1060
1190
460
680
1070
1190
470
690
1080
1200
480
700
1090
1210
490
700
1100
1220
500
710
1110
1230
510
720
1120
1240
520
730
1130
1240
530
740
1140
1250
540
750
1150
1260
550
760
1160
1270
560
760
1170
1280
570
770
1180
1290
580
780
1190
1300
590
790
1200
1300
600
800
1210
1310
610
810
1220
1320
620
810
1230
1330
630
820
1240
1340
640
830
1250
1350
650
840
1260
1350
660
850
1270
1360
670
860
1280
1370
680
870
1290
1380
690
870
1300
1390
700
880
1310
1400
710
890
1320
1410
720
900
1330
1410
730
910
1340
1420
740
920
1350
1430
750
920
1360
1440
760
930
1370
1450
770
940
1380
1460
780
950
1390
1460
790
960
1400
1470
800
970
1410
1480
810
970
1420
1490
820
980
1430
1500
830
990
1440
1510
840
1000
1450
1510
850
1010
1460
1520
860
1020
1470
1530
870
1030
1480
1540
880
1030
1490
1550
890
1040
1500
1560
900
1050
1510
1570
910
1060
1520
1570
920
1070
930
1080
940
1080
950
1090
960
1100
970
1110
980
1120
990
1130
1000
1140
Using the table:
You’ll often hear students or parents ask questions like ‘What is a 1300 PSAT score on the SAT?’ The above table gives a straight answer: a 1300 PSAT relates to 1390 on the SAT.
However, it’s not that simple. The above table, while great, is based on test-takers’ averages. To get a more realistic and accurate conversion, you need a calculator that's based on what a student actually answered.
For a dynamic score estimate based on actual practice test performance rather than a static concordance chart, use EdisonOS's PSAT-to-SAT score calculator.
PSAT to SAT Section Score Conversion
You want to keep in mind three important points while discussing PSAT to SAT sectional score conversions.
Direct correspondence, but…: Sure, the score a student receives in Math/R&W for the PSAT is the same score they’d receive in the SAT Math/R&W. For instance, a 580 on PSAT Math corresponds roughly to 580 on SAT Math. However, the total sectional scores are not the same. PSAT sectional scores are capped at 760, while the SAT sectional scores are capped at 800.
Not a direct prediction: Correspondence doesn’t guarantee the score. If Teddy got 610 on PSAT R&W, he’ll likely get 610 on SAT R&W. That’s to be treated as the most likely event, not a guarantee.
Different percentiles: The SAT covers more ground and has more difficult questions than the PSAT. Hence, even if the scores appear the same, you’d need a higher score in the SAT to reach the same percentile. A rule of the thumb is that you’ll need to score 40–50 points higher on the SAT to reach the same percentile ranking you achieved on the PSAT.
How Accurate Is the PSAT-to-SAT Conversion?
The PSAT to SAT conversion is quite accurate, but you need to keep a margin. The actual conversion could deviate about 50 points either way - upto 100 points, in some cases. So, treat the conversion as a helpful starting point, not a guarantee.
The SAT measures a little more, and the way students perform can vary from test to test. Knowing what affects conversion accuracy helps you treat the PSAT as a guide.
Adaptive nature of digital tests
The SAT is now fully digital and adaptive, while the PSAT is still in transition. On the digital SAT, the difficulty of later questions adjusts based on how a student performs in earlier sections. This adaptive design can push scores higher or lower depending on test-day performance. Since the PSAT doesn’t yet mirror this format completely, conversions can’t always capture how a student might perform under the adaptive model.
Student performance fluctuations
Scores don’t just depend on ability—they also reflect how a student performs on a specific day. Some students thrive under pressure, while others struggle with timing or nerves. Even a single round of focused prep between the PSAT and SAT can significantly shift results. That variability makes it hard to assume a one-to-one score match.
Differences in difficulty and question distribution
Although the PSAT and SAT measure the same core skills, the SAT goes further, especially in math and reading. The SAT includes slightly more advanced concepts and has a different balance of question types. These shifts mean a strong PSAT performance doesn’t always translate directly to an identical SAT score—it highlights readiness, but not the final outcome.
Using PSAT scores to guide SAT prep
PSAT results provide a strong starting point, helping students estimate their SAT range and identify areas that need improvement. You can use PSAT results to:
Pinpoint weak areas. For example, if a student misses multiple grammar questions about subject-verb agreement, that’s your cue to spend time drilling those rules. Or if they lose points in algebra but ace geometry, you know where to focus your next few sessions.
Set realistic SAT target scores. Map PSAT results against desired college benchmarks. The PSAT score helps you estimate an SAT range. For example, a student scoring 1150 on the PSAT typically converts to around 1260 on the SAT. If they're targeting a college with an average admitted SAT score of 1350, the realistic improvement goal is approximately 90 points—achievable with focused preparation but requiring sustained effort over several months.
Structure lesson plans around gaps revealed in PSAT results. If a student is already strong in reading comprehension but weaker in math, you can adjust your sessions accordingly—maybe 70% math drills, 30% reading/writing practice. This way, you won’t waste time reteaching what they already know.
You’ll also have students come up and ask you ‘How much can I improve from PSAT to SAT?’ If you have an established, proven system, you can confidently say, ‘A lot’.
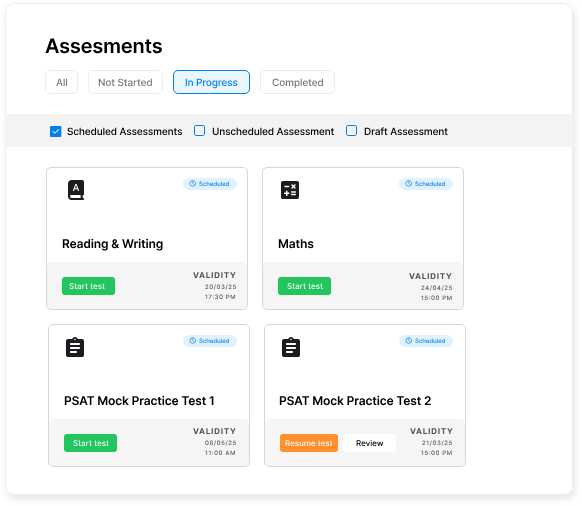
As a tutor, you’ll need a testing system that grows from the PSAT baseline into a strong, SAT-ready preparation. Only expert-designed processes like this can fully execute the prep plan. EdisonOS's content pipeline has 2 full PSAT practice tests to establish a baseline. That’s followed by 22 full SAT adaptive tests to track growth toward target and make sure there are no loose ends.
How EdisonOS supports score analysis and conversion
EdisonOS equips you with detailed analytics and customizable tools that make it easier to interpret scores and guide students toward their target ranges. Here’s an overview of the features that can help you streamline your students’ PSAT prep:
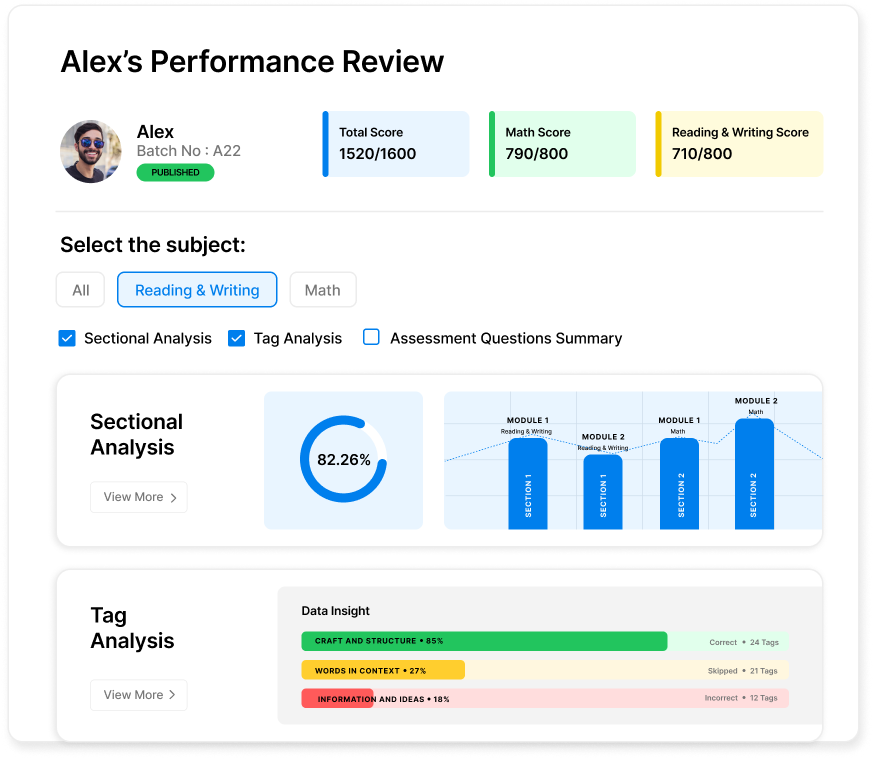
Growth tracking and analytics
Track every student’s journey from diagnostic test to full prep with real-time score calculator tools. The platform logs performance, highlights weak areas, and shows trends.
Loaded question bank & Build Your Own Tests (BYOT)
Access 5,000+ expert-vetted questions and 22 adaptive tests, or create realistic practice tests in under an hour that mimic the official digital PSAT experience.
Identify areas of improvement
Use detailed performance breakdowns to pinpoint gaps—whether it’s skill accuracy charts, performance by difficulty, skill trends over time, or pacing—and set measurable goals.
Curriculum builder for personalized study plans
Turn raw performance data into step-by-step prep plans. Assign targeted lessons, track progress, and adjust timelines as students advance.
The bottom line
PSAT scores provide valuable insights into SAT readiness when interpreted correctly. Conversion charts can give helpful estimates, but they don’t promise outcomes. Real success comes from using PSAT results to pinpoint skill gaps, build targeted study plans, and track progress over time.
Use tools like EdisonOS to run accurate PSAT-to-SAT score conversions, visualize growth, and design personalized prep plans that keep both students and parents motivated. With the right approach, PSAT results become a launchpad for SAT success.
Kavya Bansal is a copywriter, designer and artist who loves everything creative. With an experience in social media, advertising and blog writing, she lives to learn and unlearn
Tutors Edge by EdisonOS
Get Exclusive test insights and updates in our newsletter, curated to help tutors stay ahead!
Thanks for subscribing! The 'Digital SAT Breakdown Report' has reached your inbox!
Oops! Something went wrong while submitting the form.


.png)


.png)
.webp)
