ACT Composite Score Calculator (Enhanced + Old ACT)
Explore the EdisonOS ACT Scoring Chart: Convert raw scores to scaled scores (1 - 36) across English, Mathematics, and Reading, and Science, plus composite score breakdowns. Ideal for students and SAT/ACT tutors.
The ACT scoring chart shows how raw scores (number of correct answers) are converted into scaled scores ranging from 1 to 36 for each section.
Your composite ACT score on the Enhanced ACT (2025+) is calculated by averaging the English, Mathematics, and Reading section scores and rounding the result to the nearest whole number.
There is no penalty for incorrect answers, which means guessing is better than leaving a question blank.
ACT score reports also include college-readiness benchmarks and score ranges to provide more context for your performance.
ACT score band helps understand performance: Scores between 25 and 36 are considered above average, 17–24 fall within the average range, and scores below 17 indicate areas that may need improvement.
More than 1.3 million high school students take the ACT as part of their college admissions plans. But once the test is over, the next question many students have is: What does my score actually mean?
You might know that ACT scores fall between 1 and 36, but the way those scores are calculated is not always obvious.
Each section of the test has a different number of questions, yet all of them are reported on the same scoring scale. The score on your report isn’t simply the number of questions you answered correctly, which can make the scoring process difficult to understand.
This is where the ACT scoring chart helps clarify it. It shows how your correct answers in each section are converted from raw scores to scaled scores.
Here, we discuss how the chart works in practice and what it tells you about your ACT score. But first, a quick look at what the ACT scoring chart is.
What is the ACT Scoring Chart?
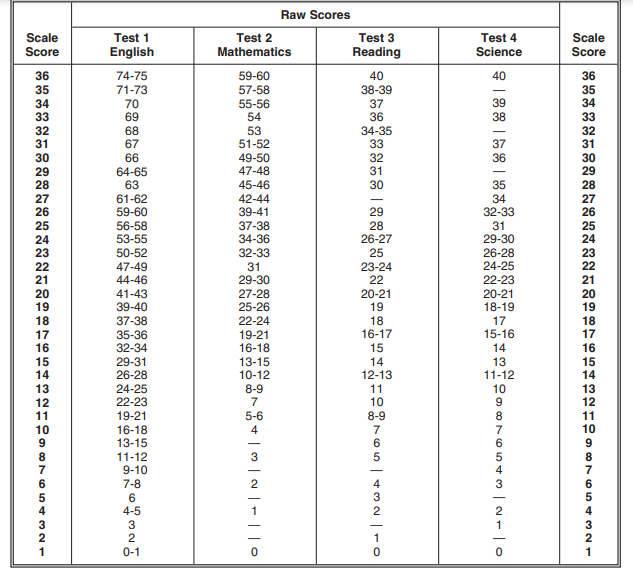
The conversion chart is a tabular reference that the ACT uses to convert raw scores into scale scores.
Let’s say you answered 67 questions correctly in Test 1 English. From the table, you can see that a raw score of 67 in English corresponds to a scaled score of 31 (In contrast, a scaled score of 31 in Mathematics would need 51 or 52 correct answers).
Different test dates may use different conversion charts to calculate scale scores.
How are ACT scores calculated?
To begin with, the ACT looks at the number of correct answers in each section. For every correct answer, you get one point. For instance, if you’ve answered 37 questions correctly in the Math test, you get 37 points, which is called the raw score.
Using a conversion chart, the ACT converts the raw score into scale score. Remember, there’s no penalty for incorrect answers.
Finally, the ACT corporation calculates the composite score by averaging the scaled scores of the three required sections (English, Math, and Reading). If the average contains fractions, it is rounded to the nearest integer.
Any values below 0.5 will be rounded off to the previous whole number, while any value equal to or above 0.5 will be rounded off to the next whole number. So an average of 30.1 or 30.4 is rounded off to 30, while an average of 30.5 or 30.9 will be rounded off to 31.
Your ACT scorecard reports the sectional scale scores as well as the composite score.
Only the best ACT prep apps can accurately simulate this scoring process. It’d take a high-impact ACT test prep platform to show to students how their raw scores translate into final results.
What are raw scores and scale scores?
The number of correct answers in a section is called the raw score of the section. It’s called so because it’s yet not ready for reporting. They do not accurately compare your performance with that of someone else who took the ACT on a different date.
Raw scores are adjusted so that the slight variations across different test dates are neutralized. The final scores arrived at after this adjustment are called scale scores.
Enhanced ACT vs. Old ACT: How the Composite Score Calculation Changed
The old ACT composite score was the average of scores across four sections (English, Mathematics, Reading and Science). Against that, the Enhanced ACT score is the average of scores across three sections (English, Mathematics, and Reading).
Because the Science section is optional in the Enhanced ACT, the composite score of the Enhanced ACT does not include the score in the Science section. Under the Enhanced ACT you no longer need to prepare for or worry about your Science scores pulling your composite scores down.
How to Calculate Your ACT Composite Score: Step-By-Step With Example
Let us use an example to understand this. Assume that Fiona appeared for the old ACT last year and then appeared for the Enhanced ACT very recently.
Old ACT scores
Whether counted for the Composite scores
Composite scores
Enhanced ACT scores
Whether counted for the Composite scores
Composite scores
English
29
Yes
25
29
Yes
26
Mathematics
24
Yes
24
Yes
Reading
25
Yes
25
Yes
Science
22
Yes
22
No
Here’s how the scores were calculated:
Composite scores for the old ACT:
Step 1: Add the scores of all the four sections
29 + 24 + 25 + 22 = 100
Step 2: Divide the above total by the total number of sections:
Here, the number of sections are 4: English, Mathematics, Reading and Science
100 / 4 = 25
Step 3: The final composite score = 25
Composite scores for the Enhanced ACT:
Step 1: Add the scores of all the four sections
29 + 24 + 25 = 78
Step 2: Divide the above total by the total number of sections:
Here, the number of sections are 3: English, Mathematics, and Reading
78 / 3 = 26
Step 3: The final composite score = 26
As you can see, although her sectional scores were identical in both the ACTs, Fiona’s composite score for old ACT is different from her Enhanced ACT scores.
How Many Questions Can You Miss to Hit Your Target Score?
Contrary to popular belief, you may not need to attempt all the questions correctly in order to score a perfect 36. For instance, you can get upto 3 questions wrong on the ACT Mathematics section and still get a perfect 36.
The following table summarizes the approximate number of questions that you can miss (or get wrong) and yet reach your target score.
Target Composite
English (50)
Mathematics
(45)
Reading (36)
Approx Total Missed Across Core Sections
28
40 - 42 correct
34 - 36 correct
29 - 31 correct
About 20 - 28 missed
30
43 - 45 correct
37 - 39 correct
31 - 33 correct
About 14 - 20 missed
32
45 - 47 correct
39 - 41 correct
33 - 34 correct
About 8 - 14 missed
34
47 - 49 correct
42 - 44 correct
35 - 36 correct
About 3 - 7 missed
36
48 correct
44 correct
36 correct
About 0 - 2 missed
Why this happens
The first reason is field items. The ACT places some unscored, experimental questions to test new content for future tests. There’s no way for the student to tell these experimental questions from the regular, scored questions.
Also, the ACT uses a process called equating, which adjusts scores based on the difficulty of a particular test form. If one version of the test is harder than another, you may be allowed to miss more questions and still earn the same scaled score. Conversely, on an easier test, fewer mistakes can lower your score more sharply.
So ACT scores are not based purely on the number of correct answers. First, your raw score (questions correct) is calculated, then converted into a scaled score from 1-36. This keeps scores fair across different test dates and versions.
That’s why a student could miss 5 mathematics questions and still get a 34 on one ACT, but only a 33 on another.
Limitations
You would want to remember that the above table is correct in some cases, but not all. Here are the three things you want to remember:
How many questions you can get wrong on an ACT section without hurting your score depends on the test version. There is no one number that fits all.
Some sections are less forgiving than others. English is notorious for being the least forgiving. It’s unlikely that you get even one question wrong in the section and yet score a perfect 36 in English.
For each score, more than one combination of correct and incorrect questions. So the table above shows one of the many cases possible.
Caution
While getting one or two questions wrong may not rob you of your dream score, use this understanding only as a piece of information. Do not convert this into a strategy. Do not, for instance, enter the test center with the goal of attempting 5 fewer questions. Your goal should always be to attempt all the questions.
The ACT STEM Score: What it is And When it Matters
The STEM score is a separate score calculated from the Mathematics and Science sections of the ACT. The ACT reports it, like all other sections, on a scale of 1 to 36.
The STEM score is simply the average of the Mathematics and Science scores (rounded according to ACT rules). On the Enhanced ACT, Science is not a compulsory section, so the STEM scoring rules can vary depending on the test version.
The STEM score is particularly useful for programs like:
Engineering
Computer science
Physics
Pre-med
Merit scholarships
Honors or specialized STEM programs
Programs that are more likely to lead to graduate school research courses
Finally, STEM scores are available only if you take the Science section, which is optional in the Enhanced ACT.
Note:
Because the Science section is now optional, the ACT STEM score may actually become more strategically important for engineering/STEM applicants. That’s because it could help them prove their strength beyond the new 3-section composite.
That said, students need to remember that the STEM score is supplementary, and not the main criterion. The composite score is more important in most colleges, even for their above mentioned courses. An old report by the ACT says the STEM score correlates to success in first-year STEM courses.
ACT Writing and ELA Scores: Do They Affect Your Composite?
Short answer, no, the Writing section does not affect the ACT Composite score. The Composite scores in the Enhanced ACT is impacted only by English, Mathematics, and Reading only.
The ELA (English Language Arts) score is a combined score derived from:
English
Reading, and
Writing (if taken)
Just like the STEM score, the Writing and ELA scores are a different combination of scores meant for a specific purpose. I the test-taker doesn’t attempt the Writing section, the English and Reading section scores are the only indicators available to a college looking for language proficiency.
These scores help in
Selective humanities programs
Scholarship applications
Writing-intensive majors
In reality, very few colleges now require ACT Writing, especially after the Enhanced ACT redesign. Consequently, fewer students than before might opt for the Writing section.
Raw ACT Score to Scaled Score Conversion
ACT scores are not reported directly based on the number of correct answers. Instead, your raw score, i.e. the number of questions you answer correctly in a section, is converted into a scaled score ranging from 1 to 36.
This conversion process exists because not every ACT test form is equally difficult. To ensure fairness, ACT uses a method called equating, which adjusts scaled scores so that performance is comparable across different test dates.
Each section has its own raw-to-scaled conversion. This means:
A raw score of 60 in English does not convert the same way as a raw score of 60 in Mathematics
Slight differences in test difficulty can change how many raw points are needed for a given scaled score
Because ACT does not release exact conversion tables for every test form, score conversions are typically presented as ranges rather than fixed values.
Understanding these ranges helps students prepare for ACT exams more strategically and focus on the sections where small improvements in raw scores can significantly increase scaled scores.
There are 2 things you want to notice about the conversion scale mentioned here.
They account for the field test items. For instance, you’ll see 50 questions on the English section in the actual ACT. However, the field test items are not used for your scores. As a result the highest raw score for a given test section is the number of correct answers after removing the field test items.
Each section has a different number of field test items. You’ll see English had 10 field test items while Mathematics had 9. Each section has its own number of field items, so you can’t generalize.
Note: These ranges are meant to help you understand scoring behavior, not predict exact results. Actual scaled scores depend on the specific test version.
Understanding raw-to-scaled conversion helps you:
Set realistic score goals
Identify which sections need improvement
Avoid over-interpreting small changes in raw scores
A difference of just 1-2 raw points can sometimes shift a scaled score, especially near higher score ranges.
Why the ACT uses the conversion chart
There are two reasons the ACT uses the conversion chart. One, while the number of questions in each section may be different, the scorecard needs to report your performance in each section on a score range of 1 to 36. That’s what the conversion chart helps do.
Secondly, conversion brings parity of scores for tests conducted on different dates. The ACT clearly says, “ Scale scores have the same meaning for all the different forms of the ACT test, no matter which date a test was taken”. That means you can compare the scores of tests conducted on different dates without having to worry about their difficulty levels.
While ACT tests on different dates are meant to be similar, there’s a small variation in their difficulty level. So getting 31 Mathematics questions correct on one date might just be as difficult as getting 27 Mathematics questions correct on another date.
Two students who took the ACT on different dates might have received slightly different raw scores, but the ACT raw score conversion grid gives them the same scaled scores. This adjusts the scores to the difficulty level of each test and ensures that the scores reported are fair.
Here is the sample ACT scoring chart for reference:
Two students who took the ACT on different dates might have received slightly different raw scores, but the ACT raw score conversion grid gives them the same scaled scores. This adjusts the scores to the difficulty level of each test and ensures that the scores reported are fair.
Conversion chart for Day 3
Raw Score
Scale Score
31
23
29-30
22
28
21
Conversion chart for Day 8
Raw Score
Scale Score
27
23
26
22
24-25
21
Different test dates may use different conversion charts, based on various factors including the difficulty level of the test of that date.
What Is a Good ACT Composite Score?
How your scores compare to the other students vying for the same university significantly impact your chances of getting into your dream university.
One way of defining a good ACT score could be checking the national average: If you’ve scored more than the average, you can say you’ve done better than the national average. The latest available ACT annual report says the national average composite score for 2024-2025 is 19.4.
The following is also from the same source for the graduating class 2025:
Percent of students who met College Readiness Benchmarks
Total students
English
National
Mathematics
National
Reading
National
1,380,130
50
29
39
Average ACT scores nationwide
Total students
English
National
Mathematics
National
Reading
National
1,380,130
18.4
18.9
20.0
The answer to the question ‘what is a good ACT score’ depends upon the school you’re looking to get into. For example, students applying to selective universities often focus on improving specific sections and even learning how to calculate ACT superscore, since many colleges consider the highest section scores across multiple ACT attempts.
At more selective schools like Princeton, for instance, you’d stand a better chance if your ACT score is 33 and above. Against that, the average ACT score at the University of Utah is 27. But then, its course in Research and Experimental Psychology at the University of Utah is highly prized.
Research the schools you intend to apply to. Collect information from their websites, speak to their admission office, and meet with counsellors. That will tell you the target ACT score you should aim for. And that’s what would be a good ACT score for you.
ACT Test Score Ranges
There are three things we need to understand when we talk about the ACT scores.
1. The composite score
The ACT score range demonstrates how well did the student performed in the actual exam. How good is your performance if you scored 31? Or 14? Or 22?
We divide the ACT scores into three ranges.
You scored between 25 and 36:
You’ve scored above average. And if you’re above 33, well, consider it an excellent score. The closer you’re to 36, the better your chances for scholarships as well as for admissions to competitive schools.
In addition to highly competitive schools like Harvard, Stanford, and Yale, some of the other universities best suited for this score range are:
Johns Hopkins University
The University of Texas at Austin
University of Pennsylvania
The University of Illinois at Urbana-Champaign
University of California, Los Angeles
Texas A&M University
You scored between 17 and 24:
This score is considered average and shows considerable competence. You might have some chance at a few good schools, subject to the strength of other factors in your application.
For this range of ACT scores, you could target universities like:
Portland State University
La Salle University
Western Michigan University
California State University, Fullerton
California State University, Northridge
North Carolina A&T State University
You scored below 17:
Scores below 17 are considered below average. If you plan to take the ACT again (which you probably will), you know the areas that need improvement. As a general practice, most universities will require a minimum ACT score of 18.
For example, using ACT pacing tips can help you manage time more efficiently during the exam, while targeted subject strategies, such as ACT science tips, can improve accuracy in difficult sections.
Note: The names of universities above are indicative only. Be sure to do your research or speak to a qualified counselor.
2. College Readiness Benchmark
But there’s more. The ACT also displays a score called a College Readiness Benchmark. Think of it as a certain standard that indicates the probability of how you’ll do in the first year of your college.
According to the ACT, if you’ve scored equal to or more than the CRB, ”you have at least a 50% chance of obtaining a B or higher or about a 75% chance of obtaining a C” in a corresponding subject in the first year at college.
In the sample ACT scorecard of a student above, the circled numbers are College Readiness Benchmark (CRB) scores. The student has scored 24 in English, while the CRB for the same is 18. That means the student has a good chance of doing well in that subject area at college.
3. Score range
The Score Range refers to the very small margin of error with similar standardized tests.
The ACT clearly says these scores are “estimates of your educational development”. That means there could be a deviation of about 1 point in the Composite scores above or below your score.
In simpler words, if you were to take a similar standardized test elsewhere, your composite score could turn out 1 point more or 1 point less than the score you’ve received on the ACT.
This is actually a very powerful statement about the reliability of the ACT. The variation of just 1 point indicates that the test has measured your skills to a very high level of accuracy and hence the scores are reliable for further use.
The ACT also mentions the variation possible in writing, STEM, and ELA scores.
How do tests, questions, and reporting categories relate to one another?
The ACT test-makers take great care in ensuring that every section covers all the relevant topics in the right proportion. Which means it’s impossible that one ACT exam has 13 questions from Probability while another has none.
It’s no surprise that the categories that each section will cover are fixed. The number of questions within each category too are pre-defined.
The below table shows the reporting categories of the English test in the ACT. Note how one category takes up over half the section.
Section
Reporting category
Number of items
Percentage of test
English
Production of writing
22 – 24
29 – 32
Knowledge of language
11 – 13
15 – 17
Conventions of standard English
39 – 41
52 – 55
The reporting categories of the ACT Mathematics test show a preference for integrating essential skills. Nearly all the remaining categories enjoy an equal weightage.
Section
Reporting category
Number of items
Percentage of test
Mathematics
Number and quantity
5-7
8-12
Algebra
7-9
12-15
Functions
7-9
12-15
Geometry
7-9
12-15
Statistics and probability
5-7
8-12
Integrating Essential Skills
24-26
40-43
Modelling
≥ 12
≥ 20
The Reading test in the ACT has three categories. Here too, one category ('Key Ideas and Details') have more than half the weightage.
Section
Reporting category
Number of items
Percentage of test
Reading
Key ideas & details
21-24
53-60
Craft & structure
10-12
25-30
Integration of knowledge and ideas
6-9
15-23
Here’s what the table means. Take any official ACT. If you look at the Mathematics test, you’ll find 7 to 9 questions from Geometry. These Geometry questions form approximately 12 to 15 percent of the entire Mathematics section.
When preparing for the ACT, be sure to pay particular attention to the categories that have the maximum weightage in each section.
Please note that the above relationship will likely change a little in the digital ACT, which is shorter and has fewer questions.
What is the average ACT Test score?
Knowing what are the average scores of the ACT you plan to take could provide you some context and direction.
According to the ACT report, the national average of ACT composite scores from 2019 to 2024 have hovered around 20. In 2023-2024, for instance, the average was 19.4. So one way of looking at your performance is if you’ve scored above the national average, you could say you’ve got a good score.
In 2024, roughly 1 out of every 2 (51 percent) of the students who took the ACT met the College Readiness Benchmark for the English section. Against that, a little less than 1 in 3 (29 percent) students met the College Readiness Benchmark for Mathematics. And the number of students who met the College Readiness Benchmark for all the sections was 20 percent.
How Can Tutors Use an ACT Score Chart for Test Prep?
Tutors can use the EdisonOS ACT score chart as a strategic planning tool, not just a reporting reference.
Identify priority sections: Score charts help tutors spot which sections have the biggest impact on the composite score.
Set targeted goals: Tutors can translate score improvement goals into clear accuracy targets for each section.
Track progress over time: Comparing practice test results against the chart helps measure improvement across multiple attempts.
Guide practice decisions: Tutors can decide whether students need skill-building, timing practice, or full-length tests.
Explain results clearly: Score charts make it easier to communicate progress and expectations to students and parents.
Used consistently, the EdisonOS ACT score chart helps tutors turn test data into actionable prep strategies, making practice sessions more focused and results-driven.
How EdisonOS Can Help Tutors Improve Their Students’ ACT Scores
EdisonOS helps tutors turn ACT scores into clear action steps.
Tutors get access 10 full-length ACT practice tests and over 1,700 ACT-style questions covering English, Math, Reading, and Science. These tests follow the real ACT format, with built-in tools such as a scientific calculator, magnifier, and answer masking to help students practice under realistic conditions.
After each test, EdisonOS generates clear score reports. Tutors can see section scores, composite scores, timing data, and skill-level gaps. This makes it easy to spot where a student is losing points and why.
EdisonOS’s scoring engine handles both the Enhanced ACT (3-section) and Legacy ACT (4-section) composite formulas, so tutors can score practice tests in either format depending on which version their student is preparing for.
Performance by Difficulty: After each practice test, EdisonOS breaks down student accuracy by question difficulty (Easy / Medium / Hard). This shows tutors exactly where students lose points, whether they’re missing easy questions due to pacing or hitting a ceiling on hard ones, so the next prep session targets the right gap.
Tutors can also create custom ACT practice tests. This helps target weak areas instead of repeating full tests every time. Students improve faster when practice is focused.
By combining realistic practice, simple analytics, and flexible test creation, EdisonOS helps tutors guide students toward steady ACT score improvement, without guesswork. Start a free trial to see how a powerful platform like EdisonOS can hugely improve your students’ ACT scores.
Frequently asked questions
What is a good ACT score for Ivy League colleges?
Do colleges see your raw ACT scores?
Is 1 question wrong still a 36 on the ACT?
Do all sections weigh equally in the ACT composite score?
Does Science count in the ACT composite?
How do you superscore the ACT?
ABOUT THE AUTHOR
Tutors Edge by EdisonOS
Get Exclusive test insights and updates in our newsletter, curated to help tutors stay ahead!
Thanks for subscribing! The 'Digital SAT Breakdown Report' has reached your inbox!
Oops! Something went wrong while submitting the form.


.png)


.png)
.webp)
