Desmos strengthens conceptual understanding through real-time visual exploration.
SAT success improves when students practice with built-in Desmos tools.
Desmos Classroom reveals thinking, not just final answers.
Desmos has become an essential tool in modern math instruction. It is free, web-based, and widely used across classrooms, tutoring sessions, and standardized testing environments.
For tutors, knowing how to use Desmos well is no longer optional. The Desmos graphing calculator is built directly into the Digital SAT, PSAT, ACT, and many state assessments. Students are expected to use it confidently to explore functions, interpret graphs, and solve problems efficiently.
This Desmos calculator guide is designed specifically for math tutors. It explains how to use Desmos step by step, how to apply it across tutoring scenarios, and how to teach students to use it independently. You will learn both the technical features and the instructional strategies that make Desmos effective.
What is Desmos and why tutors need it
Before using Desmos as a teaching tool, it is important to understand what it is designed to do, how it supports learning through visualization, and why it has become so widely adopted.
(snapshot of Desmos calculator)
Designed originally for classrooms, Desmos has evolved into a powerful tool for teachers and tutors who want to make math instruction more visual and interactive. Instead of treating equations as static expressions, Desmos allows students to manipulate values and immediately see how graphs change.
For tutors, this visual feedback is critical. Many students struggle not because they cannot calculate, but because they cannot connect algebraic symbols to graphical meaning.
Tools available in Desmos
Desmos includes multiple tools that support different teaching needs, allowing you to adapt the platform for everything from quick calculations to deep conceptual exploration across grade levels and subjects.
Graphing calculator: Used for algebra, functions, systems of equations, and SAT prep
Scientific calculator: Useful for arithmetic, fractions, exponents, and test-day calculations
Geometry tool: Designed for constructions, transformations, and spatial reasoning
3D calculator: Helpful for advanced exploration in higher-level math
Desmos Classroom
The Amplify Classroom, formerly the Desmos Classroom, is designed to turn passive graphing into active learning. While many tutors associate Desmos primarily with the graphing calculator, Desmos Classroom adds an instructional layer that allows you to guide thinking, observe student reasoning, and intervene at the right moment.
Why Desmos is superior to handheld calculators for tutoring
Desmos supports conceptual learning in ways traditional calculators cannot:
Instant graphing links equations to visuals immediately
Sliders allow dynamic exploration instead of static examples
Accessibility features support diverse learning needs
The interface mirrors the digital test environments students will face a key part of test day essentials for Digital SAT preparation
For SAT and ACT tutors, Desmos familiarity directly impacts test performance.
Getting started with Desmos graphing calculator
Before using Desmos as a teaching aid, you must be comfortable navigating the tool yourself so that sessions remain focused on learning rather than troubleshooting. Fortunately, getting started with Desmos is straightforward and requires very little setup or technical overhead. This section functions as a practical Desmos graphing calculator tutorial:
Accessing Desmos
You can access Desmos in several ways:
Web browser at desmos.com/calculator
Mobile apps on iOS and Android
Embedded directly into Digital SAT and PSAT testing platforms
For tutoring, the web version is the most flexible and closely matches the testing experience.
Understanding the interface
When you open Desmos, the screen is split into two sections:
Expression list: The left panel, where equations, tables, and notes are entered
Graph area: The right panel, where the visual output appears instantly
The toolbar allows you to add tables, folders, notes, and images. Learning to move between these tools smoothly helps keep sessions focused and efficient.
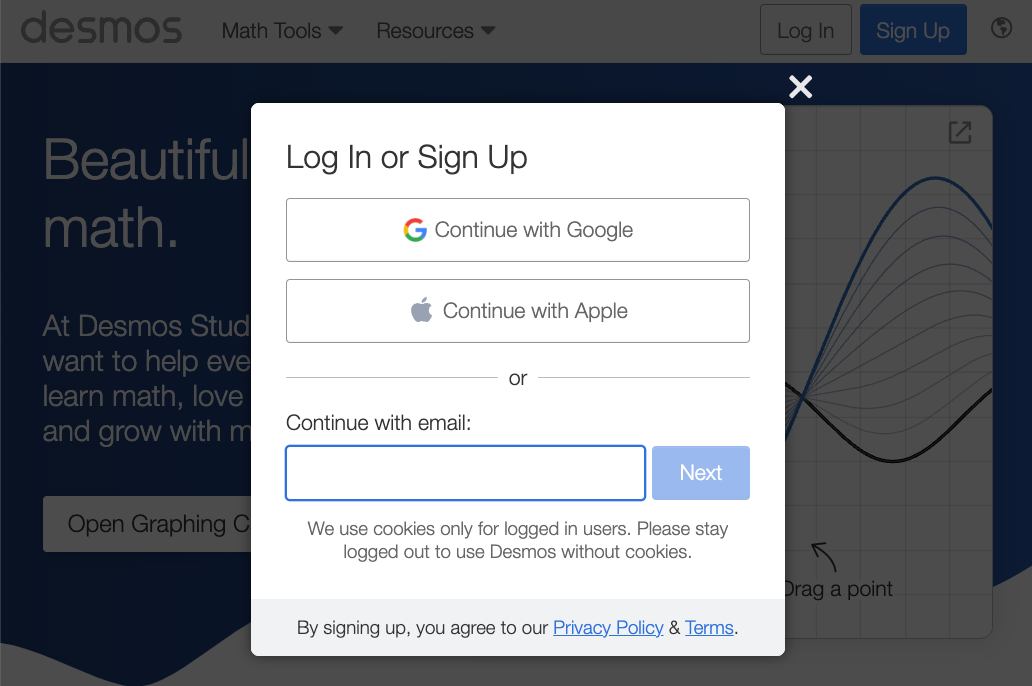
Creating an account vs using Desmos anonymously
Students can use Desmos without signing in, which is helpful for quick practice. However, creating a free account allows you to:
Save graphs for future use
Build a library of examples for different topics
Share graphs with students for homework or revision
(login and sign up on Desmos)
Once logged in, you can save graphs using the save button in the top corner. Saved graphs can be reopened later or shared via a link. This is useful for reviewing past work or assigning follow-up practice.
Essential Desmos features every tutor should master
This section covers the core Desmos features that you will use most often during tutoring sessions, focusing on tools that directly support explanation, exploration, and student understanding rather than advanced or rarely used functions.
Plotting points and graphing equations
Understanding how to graph on Desmos is the foundation for using the platform effectively, whether you are plotting simple points or exploring complex functions.
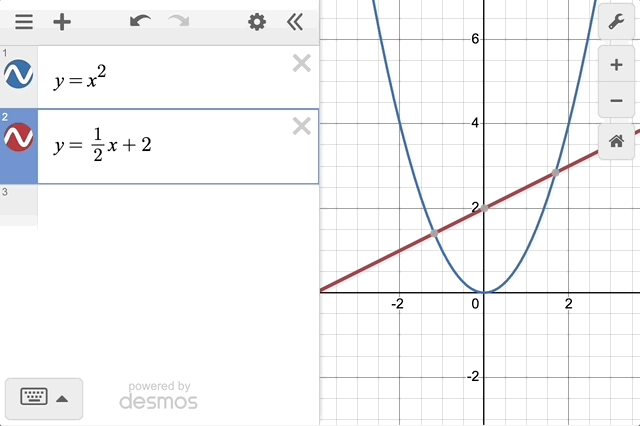
Desmos allows you to plot points using standard coordinate notation. For example, entering (1, 3) places a point at x equals one and y equals three. This is especially helpful when reinforcing coordinate geometry concepts.
You can graph equations just as easily. A linear equation like y = mx + b produces a straight line, while y = x² + 1 produces a parabola. Desmos also supports circles, absolute value functions, and piecewise expressions.
When a graph is displayed, Desmos highlights points of interest such as intercepts, vertices, and intersections in gray. Clicking on these points reveals their coordinates. This is a powerful teaching moment, as students can see exactly where key features occur instead of calculating them in isolation.
Plotting points and graphing curves)
Encourage students to identify these points visually first, then connect them back to algebraic solutions.
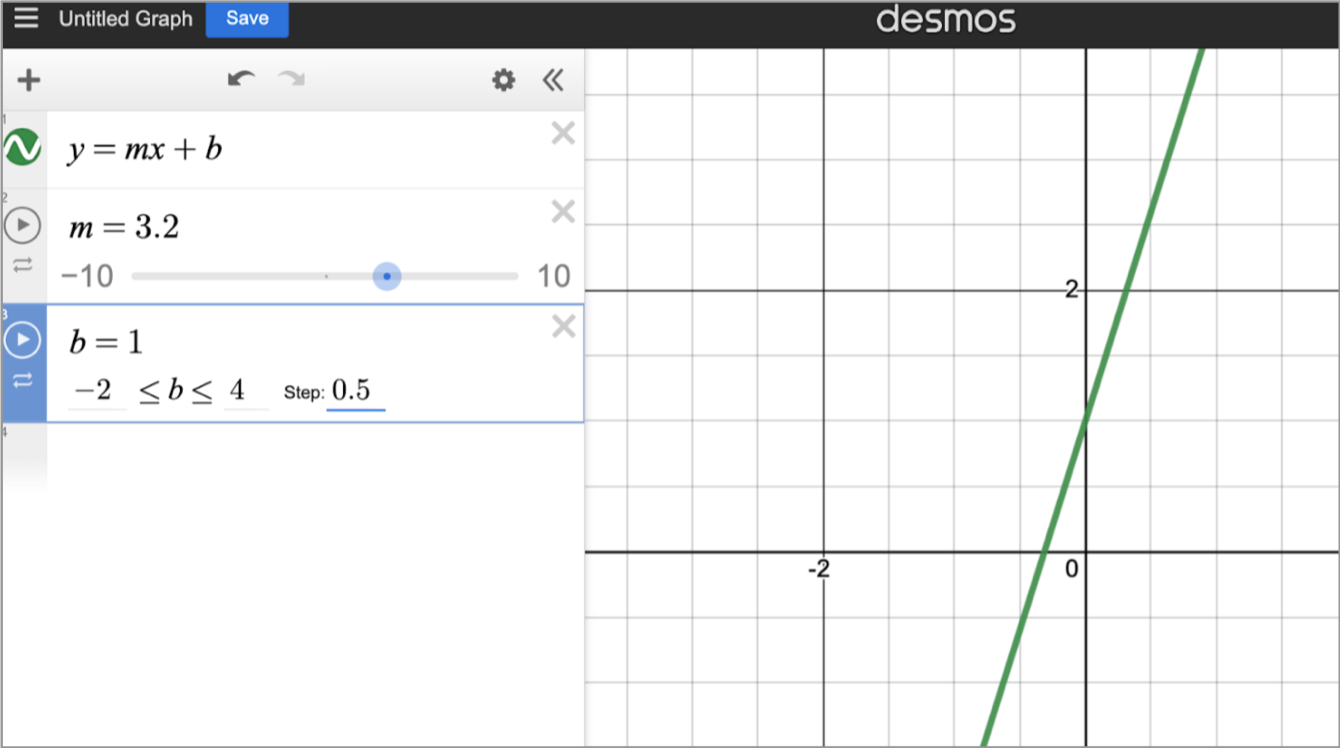
Using sliders for dynamic exploration
This section is a short Desmos sliders tutorial, showing you how to create, adjust, and animate sliders to demonstrate mathematical relationships dynamically.
Sliders are one of Desmos’s most valuable teaching tools. They allow you to replace fixed numbers with variables that can be adjusted in real time.
For example, typing y = mx + b prompts Desmos to create sliders for m and b. Moving these sliders shows how slope and intercept affect the graph.
You can adjust slider limits and step sizes to control how values change. Sliders can also be animated automatically, which helps demonstrate continuous transformations such as increasing slope or shifting graphs.
(adding sliders for variables)
How you should use sliders:
Demonstrate how slope affects steepness and direction
Show how changing intercepts shifts graphs vertically
Animate sliders to illustrate continuous transformations
Sliders are ideal for answering student questions like “What if this number was bigger?” without breaking the flow of the lesson.
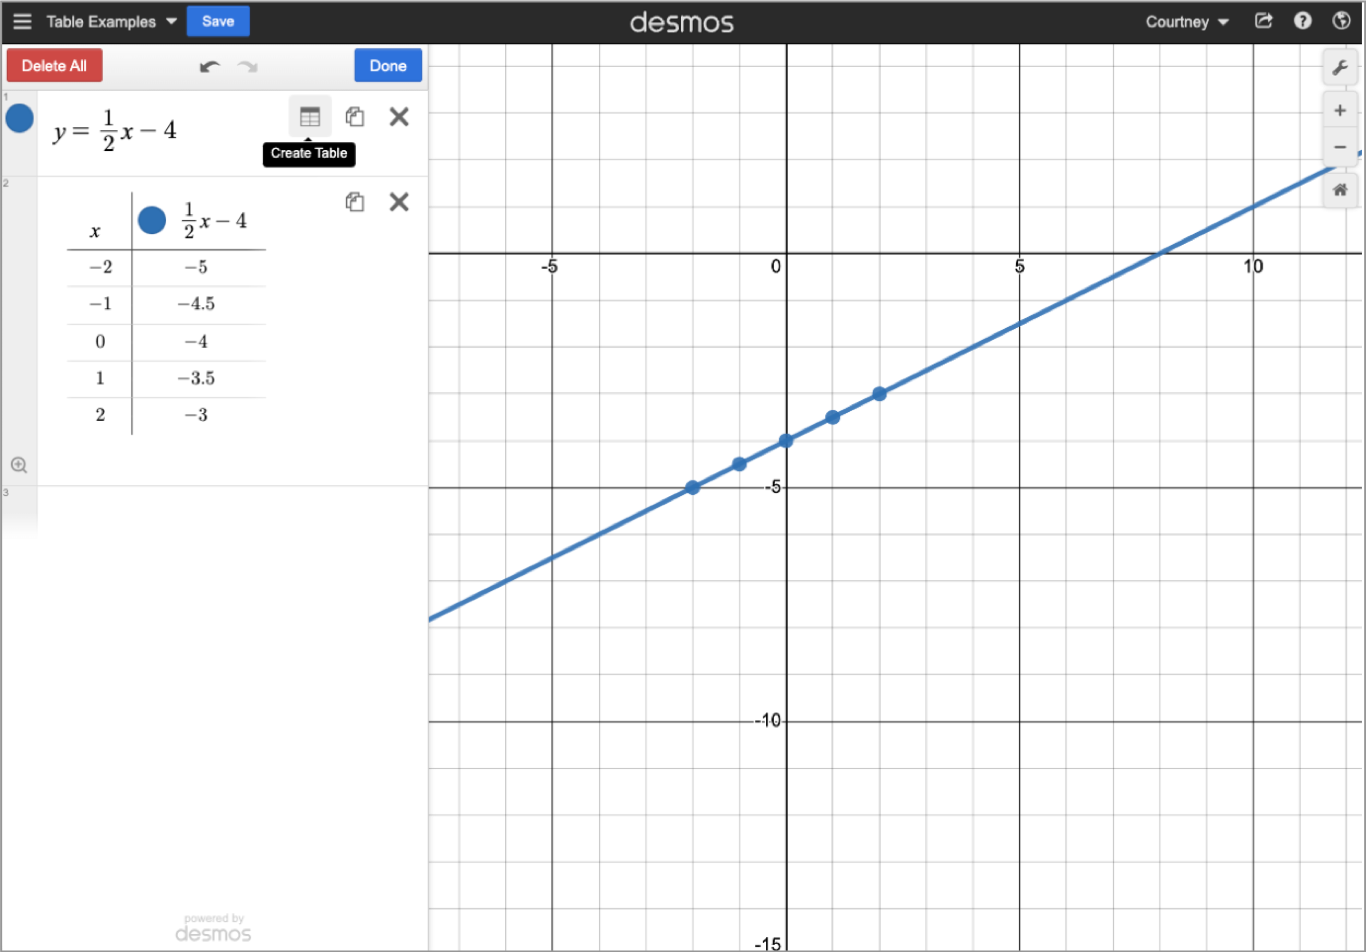
Working with tables and data
Tables help students connect numerical data with graphical representations. You can create a table manually or generate one from an existing function.
Tables are useful for:
Showing input-output relationships
Exploring patterns and rates of change
Plotting real-world data as scatter plots
(visualizing data using tables)
You can also copy and paste data from spreadsheets, which makes Desmos useful for statistics and data analysis lessons.
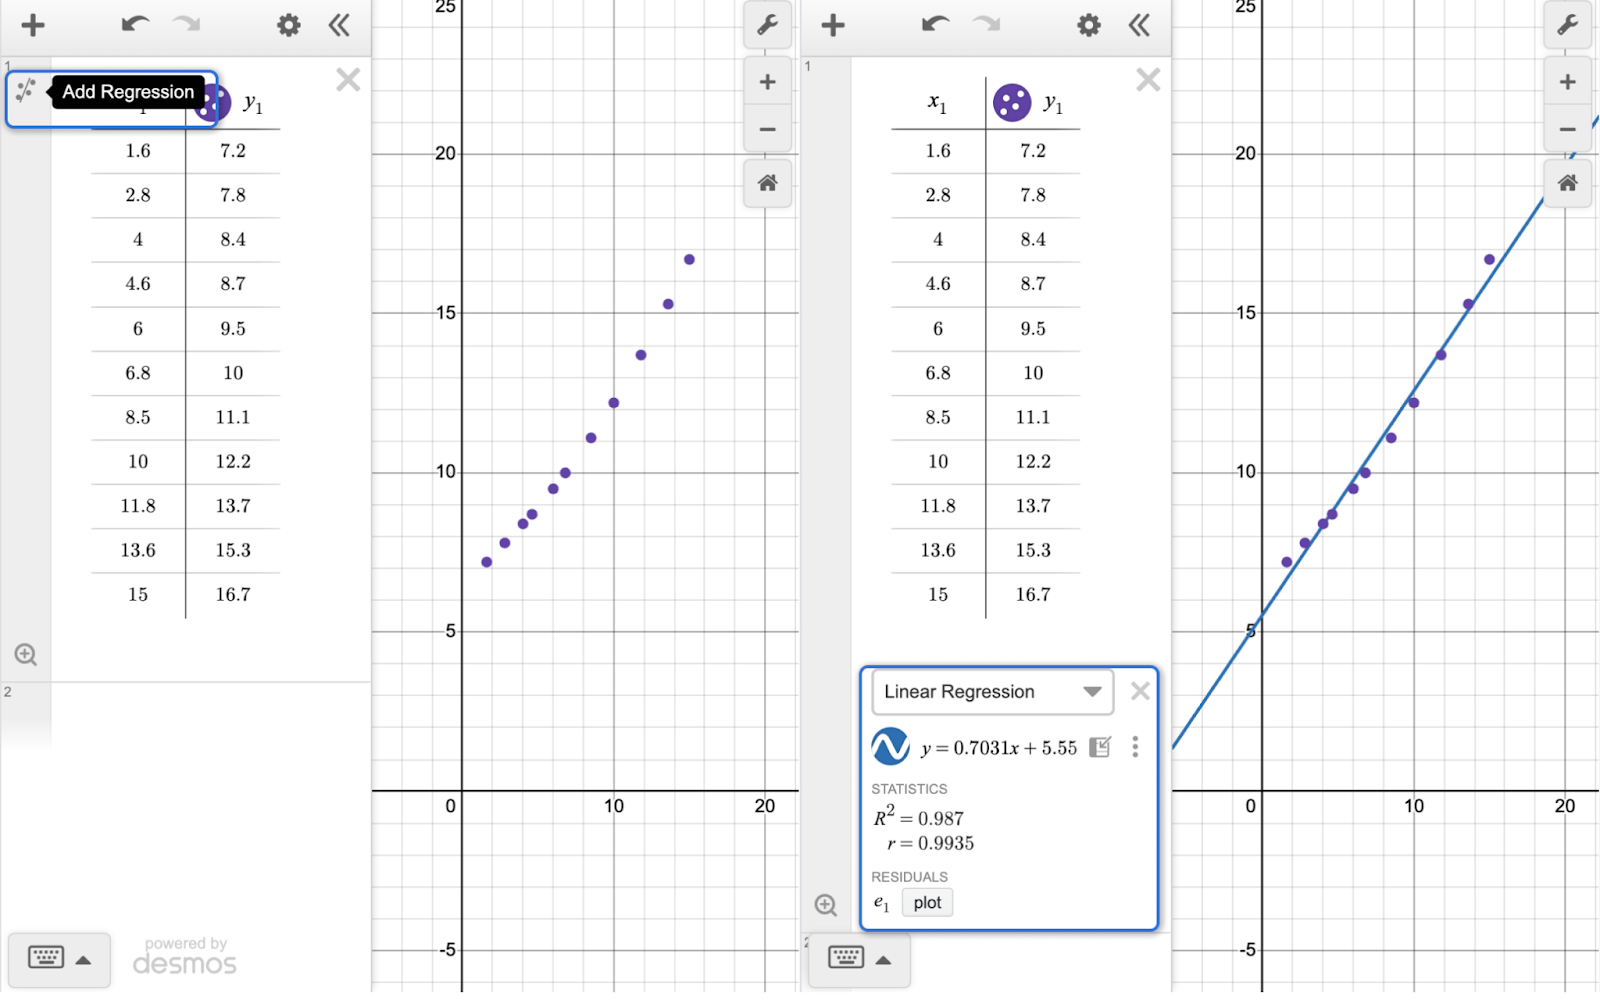
Regression lines of best fit
Desmos supports regressions using the tilde (~) symbol. Once data is entered into a table, you can model it using linear, quadratic, or custom equations.
For example, y₁ ~ mx₁ + b creates a linear regression. Desmos automatically adjusts parameters to find the best fit. Correlation values such as r and R² help students evaluate how well a model represents the data.
(using regression equation models)
This feature is especially helpful for SAT data interpretation questions and real-world modeling discussions.
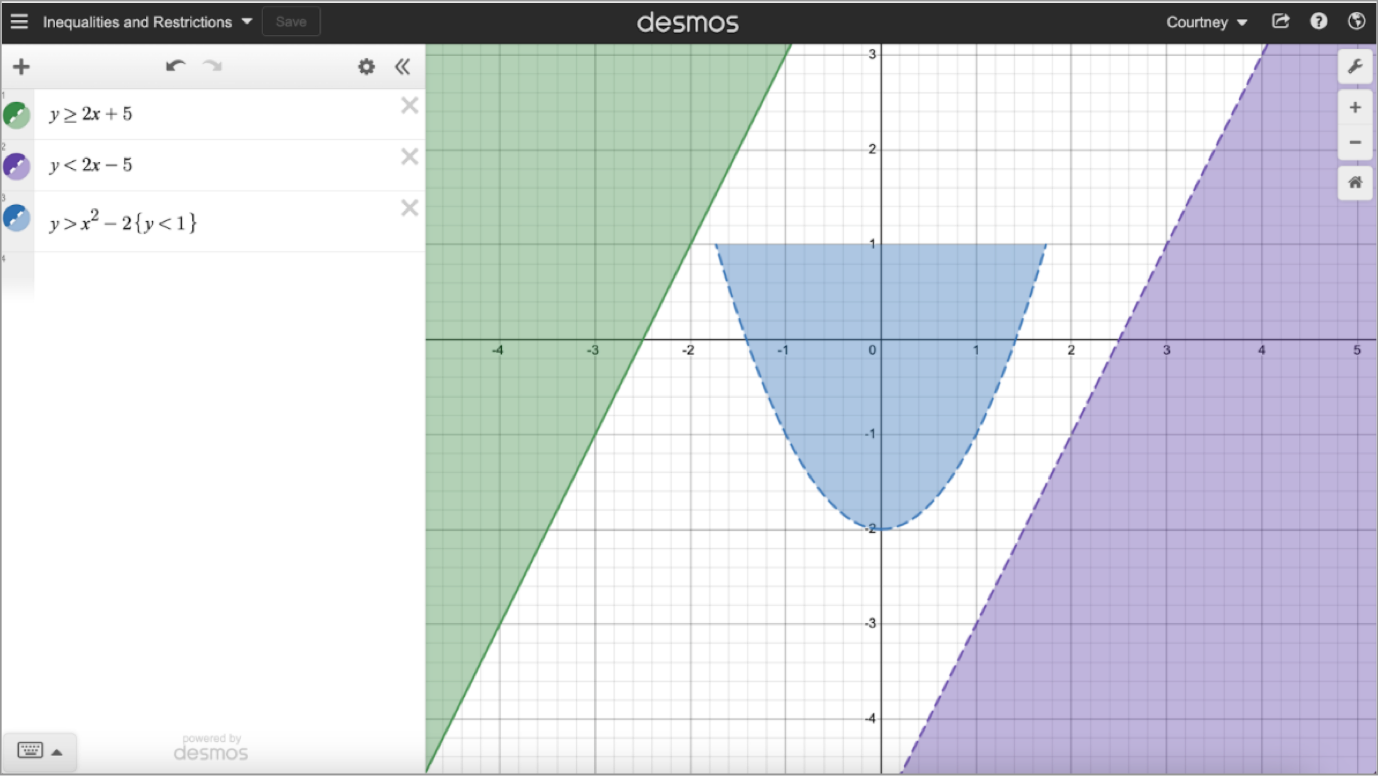
Graphing inequalities
Inequalities become much clearer when students can see solution regions.
Desmos allows you to:
Graph single inequalities using <, >, ≤, and ≥
Display systems of inequalities simultaneously
Identify feasible regions visually
(plotting inequalities on the graph)
This visual approach reduces confusion and helps students understand constraints intuitively.
Statistical functions
Desmos includes built-in statistical functions such as mean(), median(), and standard deviation(). These allow students to analyze data sets quickly.
Getting well-acquainted with supported functions shifts the focus from calculation to interpretation, which directly helps improve problem-solving scores. This is especially valuable in test prep and applied math contexts.
Using Desmos for different tutoring scenarios
Desmos adapts well to one-on-one tutoring, small groups, and classroom-style instruction. How you use it should depend on the context.
1. SAT and PSAT test prep
Because Desmos is built into the Digital SAT, learning to use it strategically is essential for effective Desmos for SAT prep. If they are unfamiliar with the tool, they often lose valuable minutes navigating the interface instead of solving problems directly affecting pacing on the SAT. Teaching Desmos fluency ahead of time helps students focus on reasoning rather than mechanics on test day.
You can use Desmos to:
Solve systems of equations by graphing: Plot both equations simultaneously and identify solutions by locating points of intersection rather than solving purely algebraically
Find intercepts and intersections quickly: Use Desmos’s gray point indicators to identify x-intercepts, y-intercepts, and intersections with precision and speed
Analyze quadratic behavior visually: Observe how parabolas open, shift, and intersect axes, which helps students understand vertex form and roots intuitively
Use sliders to explore no-solution and infinite-solution cases: Adjust parameters dynamically to show when graphs never intersect or overlap entirely, reinforcing system behavior concepts
Convert decimals to fractions and perform percent calculations efficiently: Use the built-in calculator functions to simplify values and check numerical accuracy under time pressure
An effective strategy is to graph first to understand the overall behavior of a function or system, then verify key results algebraically. This reduces careless errors and helps students choose the most efficient solution path to improve their Math score.
2. Algebra tutoring
Desmos helps students connect equations to graphs.
Use it to:
Visualize slope and intercept relationships: Adjust linear equations dynamically to show how changes in slope affect steepness and how intercepts shift the line up or down
(plotting algebraic equations on the graph)
Demonstrate parallel and perpendicular lines: Graph multiple lines together to highlight how equal slopes create parallel lines and negative reciprocal slopes create perpendicular ones
Explore transformations such as shifts, stretches, and reflections: Modify function parameters to show how graphs move or change shape without altering their fundamental structure
This strengthens conceptual understanding and reduces memorization.
3. Geometry applications
Desmos Geometry allows tutors to teach geometry as an interactive subject rather than a static one. Built on the Desmos Graphing Calculator, it lets you construct points, lines, circles, angles, and polygons that respond dynamically when moved. As students drag points and adjust objects, they can see which properties stay fixed, such as parallel lines or equal angles, helping them understand why geometric rules work, not just what they are.
For tutoring, Desmos Geometry is especially effective for teaching transformations. You can apply translations, reflections, rotations, and dilations to any object and use sliders to show how figures change as angles or scale factors vary. Labels for lengths, angles, and areas make measurements explicit, while saved constructions can be reused across sessions. This approach turns geometry lessons into guided exploration and reduces dependence on rote memorization.
(using Desmos for geometric construction)
Pre-calculus and calculus
For advanced students, Desmos supports:
Graphing trigonometric functions: Plot sine, cosine, and tangent functions to explore amplitude, period, phase shifts, and how changes in parameters affect the graph
Visual exploration of limits: Observe how functions behave as they approach a value from the left and right, helping students build intuition before formal limit notation
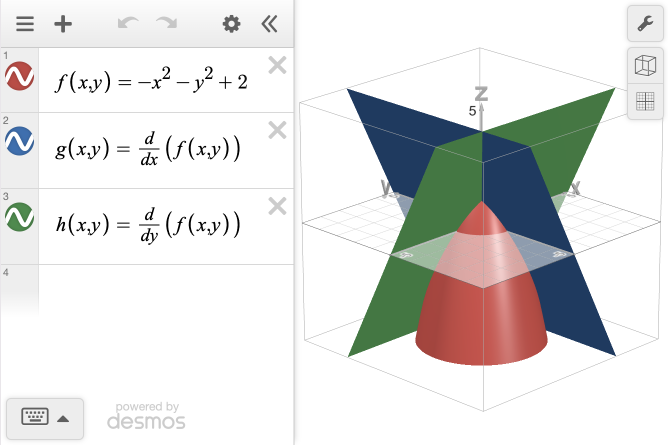
Understanding derivatives and integrals graphically: Use slopes of tangent lines and accumulated area under curves to connect calculus concepts with visual meaning
Working with parametric and polar equations: Visualize motion and complex curves that cannot be represented by single-function graphs, strengthening spatial understanding
(visualizing derivatives on Desmos)
Visualization helps students grasp abstract concepts before formal computation.
Leveraging Desmos Classroom activities
Desmos Classroom activities allow you to move beyond demonstration by giving students structured, interactive tasks that reveal their thinking in real time.
What is Desmos Classroom
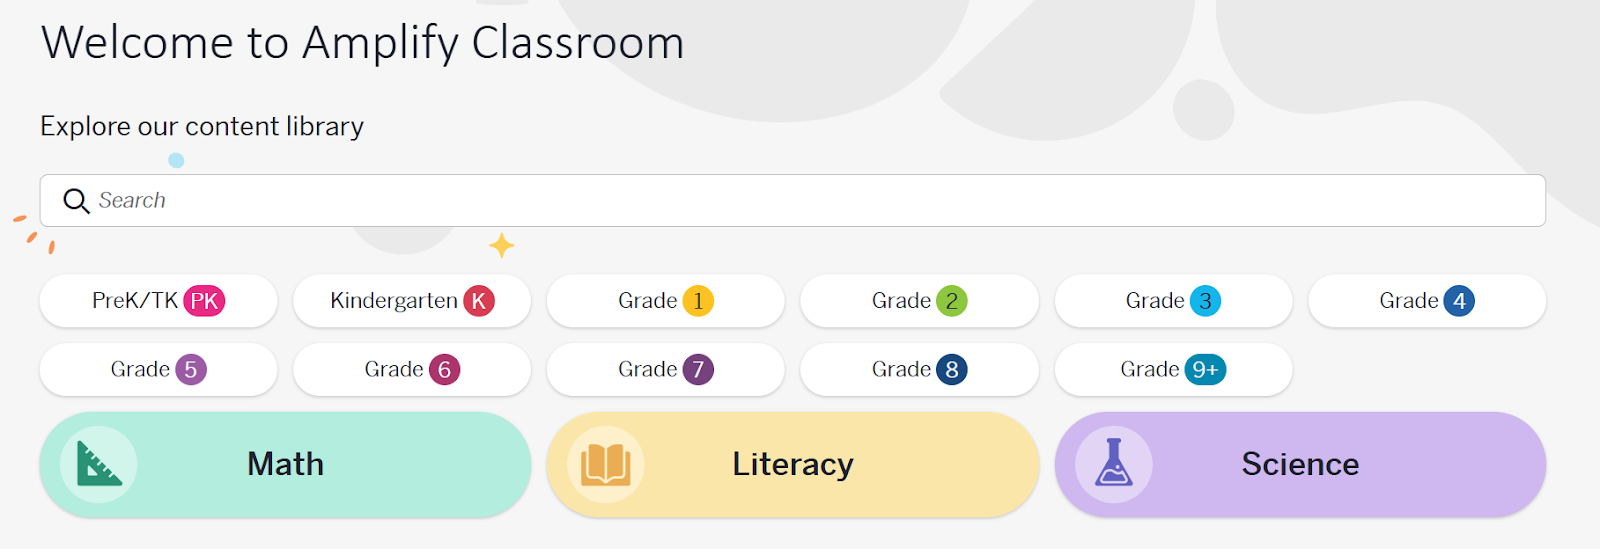
The Amplify Classroom, formerly the Desmos Classroom, is an interactive teaching platform built on top of Desmos’s visualization tools. It allows you to assign activities where students interact with mathematical ideas directly on their screens, rather than watching demonstrations.
(snapshot of Amplify Classroom homepage)
Unlike the graphing calculator, which is primarily an individual tool, Desmos Classroom is designed for guided learning. You control the activity flow, while students engage with prompts, graphs, and tasks that reveal how they are thinking.
This means you can see process, not just the final answers.
How tutors can use pre-made activities for 1:1 sessions
Most Desmos Classroom activities are designed for classrooms, but they adapt extremely well to one-on-one tutoring when used intentionally.
In a 1:1 session, you can assign an activity and have the student work through it independently for a few minutes. While the student works, you observe their responses through the dashboard instead of interrupting them constantly. This gives you insight into how they approach problems when left on their own.
You can then pause the activity and discuss specific screens. This makes feedback more targeted and productive, because you are responding to what the student actually did, not what you assume they understood.
Pre-made activities are especially useful when:
Introducing a new concept visually before formal instruction
Diagnosing misconceptions without direct questioning
Encouraging students to explain their thinking in words or graphs
Used this way, Desmos Classroom becomes a diagnostic and teaching tool, not just practice.
Popular activity types and how to use them effectively
Desmos Classroom includes several activity formats, each serving a different instructional purpose.
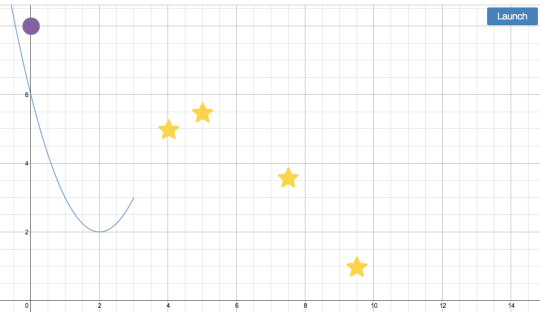
Marbleslides
Marbleslides ask students to graph functions that guide a marble to a target. This format is excellent for building intuition around slope, intercepts, and curve behavior.
Marbleslides works best when you ask students to predict what kind of equation might work before they start adjusting graphs. After completion, review the student’s approach rather than just the final graph.
(Desmos Marbleslides)
Polygraphs
Polygraphs are designed to develop precise mathematical language. Students ask yes-or-no questions to identify a graph from a set of possibilities.
Polygraphs are especially valuable for students who struggle to describe graphs accurately. They surface gaps in vocabulary and understanding, such as confusion between “increasing” and “positive” or “steep” and “vertical.”
(Desmos Polygraphs)
Card Sorts
Card Sorts require students to match representations, such as equations, graphs, and descriptions.
(Desmos Card Sorts)
These activities are ideal for reinforcing connections between algebraic and graphical forms. In a 1:1 setting, you can ask students to explain why they made each match, which reveals depth of understanding far better than multiple-choice questions.
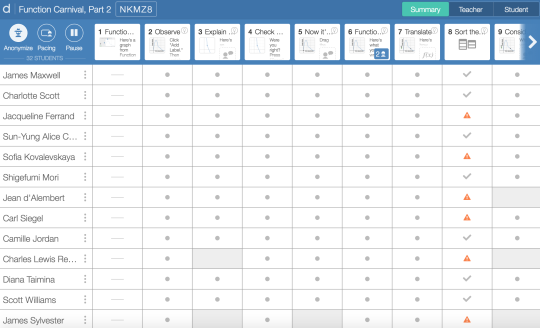
Using the Teacher Dashboard to monitor student progress
The Teacher Dashboard is one of the most valuable features of Desmos Classroom for tutors.
As students work through an activity, the dashboard updates in real time. You can see:
Which screen the student is on
Their responses and graphs
Patterns in their mistakes or misconceptions
In a tutoring context, this allows you to decide when to step in and when to let the student struggle productively. Instead of hovering or guessing, you intervene based on evidence.
The dashboard also helps you identify whether an issue is conceptual, procedural, or language-based, which informs your next teaching move.
(Desmos Activity Dashboard)
The Teacher Dashboard allows you to monitor student progress in real time. You can also create and customize activities using the Activity Builder to target specific learning goals.
Creating and customizing activities with Activity Builder
While pre-made activities cover many topics, the Activity Builder allows you to create or customize activities tailored to your students.
With the Activity Builder, you can:
Modify existing activities to match your teaching sequence
Remove unnecessary screens for focused sessions
Add reflection prompts or explanation questions
Design activities around specific SAT or curriculum skills
You can align activities directly with a student’s weak areas or upcoming assessments, making sessions more efficient and targeted.
Over time, building a small library of customized activities allows you to reuse effective lessons across multiple students without starting from scratch.
Why Desmos Classroom matters for tutors
Desmos Classroom shifts tutoring from explanation-driven to learning-driven instruction. It helps you observe thinking, guide exploration, and address misconceptions early.
When used thoughtfully, it supports deeper understanding, stronger engagement, and better retention. For tutors who want students to think rather than imitate, Desmos Classroom is a powerful addition to the tutoring toolkit.
Desmos tips and best practices for tutors
How you use Desmos has a direct impact on how much students learn from it. When used intentionally, it becomes a thinking tool rather than a demonstration screen.
Best practices include:
Learn keyboard shortcuts to maintain session flow: Moving quickly between expressions, tables, and settings helps you keep momentum and prevents sessions from feeling fragmented
Ask students to predict outcomes before moving sliders: Encourage students to build a “what if” approach. This builds reasoning and conceptual understanding for diverse situations.
Save frequently used graphs for reuse: Create a personal library of graphs for common topics so you spend less time setting up and more time teaching.
Use screen sharing carefully during online tutoring: Share your screen when introducing ideas, but shift control to the student as soon as possible to keep them actively engaged.
Teach students to explore independently rather than watch passively: Guide students to manipulate graphs themselves so Desmos becomes a tool they can use confidently on their own.
Desmos works best when students interact with it directly and use it to test ideas, not just observe results.
Common Desmos mistakes to help students avoid
Students often struggle with small technical issues in Desmos that can create confusion and slow down problem-solving these are among the most common mistakes to avoid in the Digital SAT calculator, even when the underlying math is correct.
Watch for:
Missing parentheses in expressions: Students may enter expressions without grouping terms properly, which changes the order of operations and leads to incorrect graphs
Confusing the multiply symbol with the variable x: Typing “2x” as “2×” or vice versa can cause Desmos to misinterpret the expression entirely
Incorrect exponent notation: Students sometimes forget to use the caret (^) symbol, resulting in linear expressions instead of powers
Viewing window settings that hide graphs: Important parts of a graph may fall outside the visible range, making students think nothing is happening
Degree versus radian setting mismatches: Trigonometric graphs can look incorrect if the angle mode does not match the problem context
Addressing these issues early helps reduce frustration, prevents common mistakes to avoid in Digital SAT Math, and ensures students focus on understanding the math rather than troubleshooting the tool.
The bottom line
Along with being a calculator, Desmos is also a teaching tool that helps students visualize, test, and understand mathematics.
When you use Desmos intentionally, you reduce cognitive load, improve engagement, and help students build durable understanding. Whether you are preparing students for the SAT using the best Digital SAT Math books or tutoring advanced math, Desmos can elevate your instruction.
Use SAT practice tests regularly, build a library of teaching graphs, and encourage students to explore actively.
If you are looking for a platform that integrates the Desmos online graphing calculator to replicate the Digital SAT test environment, book a demo with EdisonOS and see how Desmos-based instruction, assessment tracking, and analytics come together for SAT and ACT tutoring.
Frequently Asked Questions
Is Desmos free to use?
Can I use Desmos on the SAT?
How do I save graphs in Desmos?
What is the difference between Desmos graphing calculator and Desmos Classroom?
Can Desmos work offline?
ABOUT THE AUTHOR
Kavya Bansal
Content Writer
Kavya Bansal is a copywriter, designer and artist who loves everything creative. With an experience in social media, advertising and blog writing, she lives to learn and unlearn
Tutors Edge by EdisonOS
Get Exclusive test insights and updates in our newsletter, curated to help tutors stay ahead!
Thanks for subscribing! The 'Digital SAT Breakdown Report' has reached your inbox!
Oops! Something went wrong while submitting the form.


.png)


.png)
.webp)
