How to Read Your SAT Score Report: Sections, Percentiles & Subscores Explained
Your SAT score report shows more than a total score. Learn how to read section scores, score ranges, percentiles, domain bars, and what colleges actually see — and what they don't.
Digital SAT score reports highlight performance, readiness, and improvement areas beyond just the total score.
Section scores, percentiles, and benchmarks now drive meaningful SAT score interpretation.
Tools like EdisonOS turn score data into actionable, personalized SAT preparation strategies
Your digital SAT score report is not just a final score. It is a detailed diagnostic document that shows how you performed and where you struggled. It shows how you compare with other students, and how ready you are for college-level coursework.
That means it wouldn’t be right to define what is a good SAT score in isolation. According to the official College Board Annual Report 2025 shows that 7% of the test-takers scored 1400 or more points. If you scored 1200 or, you’d be among the top 25% of the test-takers.
With the SAT moving fully to a digital, adaptive format in March 2024, the way scores are generated and reported has changed. The updated SAT score report removes legacy elements like cross-test scores and traditional subscores, replacing them with clearer section scores, percentiles, and readiness benchmarks.
This guide explains how to download, read, and interpret your digital SAT score report. It walks through every part of the report, from section scores and percentiles to practice test analytics and advanced tools, so you can turn your score data into a clear preparation strategy.
How SAT Scores Are Calculated
Let’s quickly understand how SAT scores are calculated.
The first step of scoring is the raw scores. Your raw score is simply the number of questions you answer correctly. There is no penalty for incorrect answers.
Next, these raw scores are converted into scaled scores using a process that adjusts for question difficulty, the adaptive format, and differences between test versions. This ensures scores remain fair and comparable across test dates. Each section is scored on a scale of 200 to 800. Finally, the two section scores are added together to give your total SAT score, which ranges from 400 to 1600.
Each section has two modules. If you do well in the first module, you’ll get a harder second module. However, scaling will account for that. So, two students with the same number of correct answers in Module 2 will get different scaled scores. The one who answered questions in the harder module will receive a higher score.
The digital SAT score report essentially provides a structured summary of your performance on the SAT. It highlights:
Your total and section scores
How you performed relative to other students
Whether you are meeting college readiness benchmarks
Patterns across multiple test attempts
Areas where focused improvement can raise your score
Modern official SAT score reports are designed to support interpretation, not just reporting. Understanding how to read them correctly is critical for effective preparation.
Key Changes in the Digital SAT Score Report (2024 and Beyond)
In March 2024, the SAT officially transitioned to a digital, adaptive exam format. The shift changed how scores are generated and presented, making section scores and percentiles more central to score interpretation.
What changed:
Adaptive testing determines question difficulty by module
Cross-test scores were removed
Traditional subscores were removed
Reporting now emphasizes section-level performance and percentiles
What stayed important:
Section scores (Reading & Writing, Math)
Percentile rankings
College readiness benchmarks
Practice-based performance trends
The result is a digital SAT score report that is simpler to read but requires correct interpretation to extract meaningful insights.
How to Read Your SAT Score Report: Section Scores, Percentiles, and Benchmarks
Your SAT score report shows you your overall performance and how you did compared to the entire set of test-takers.
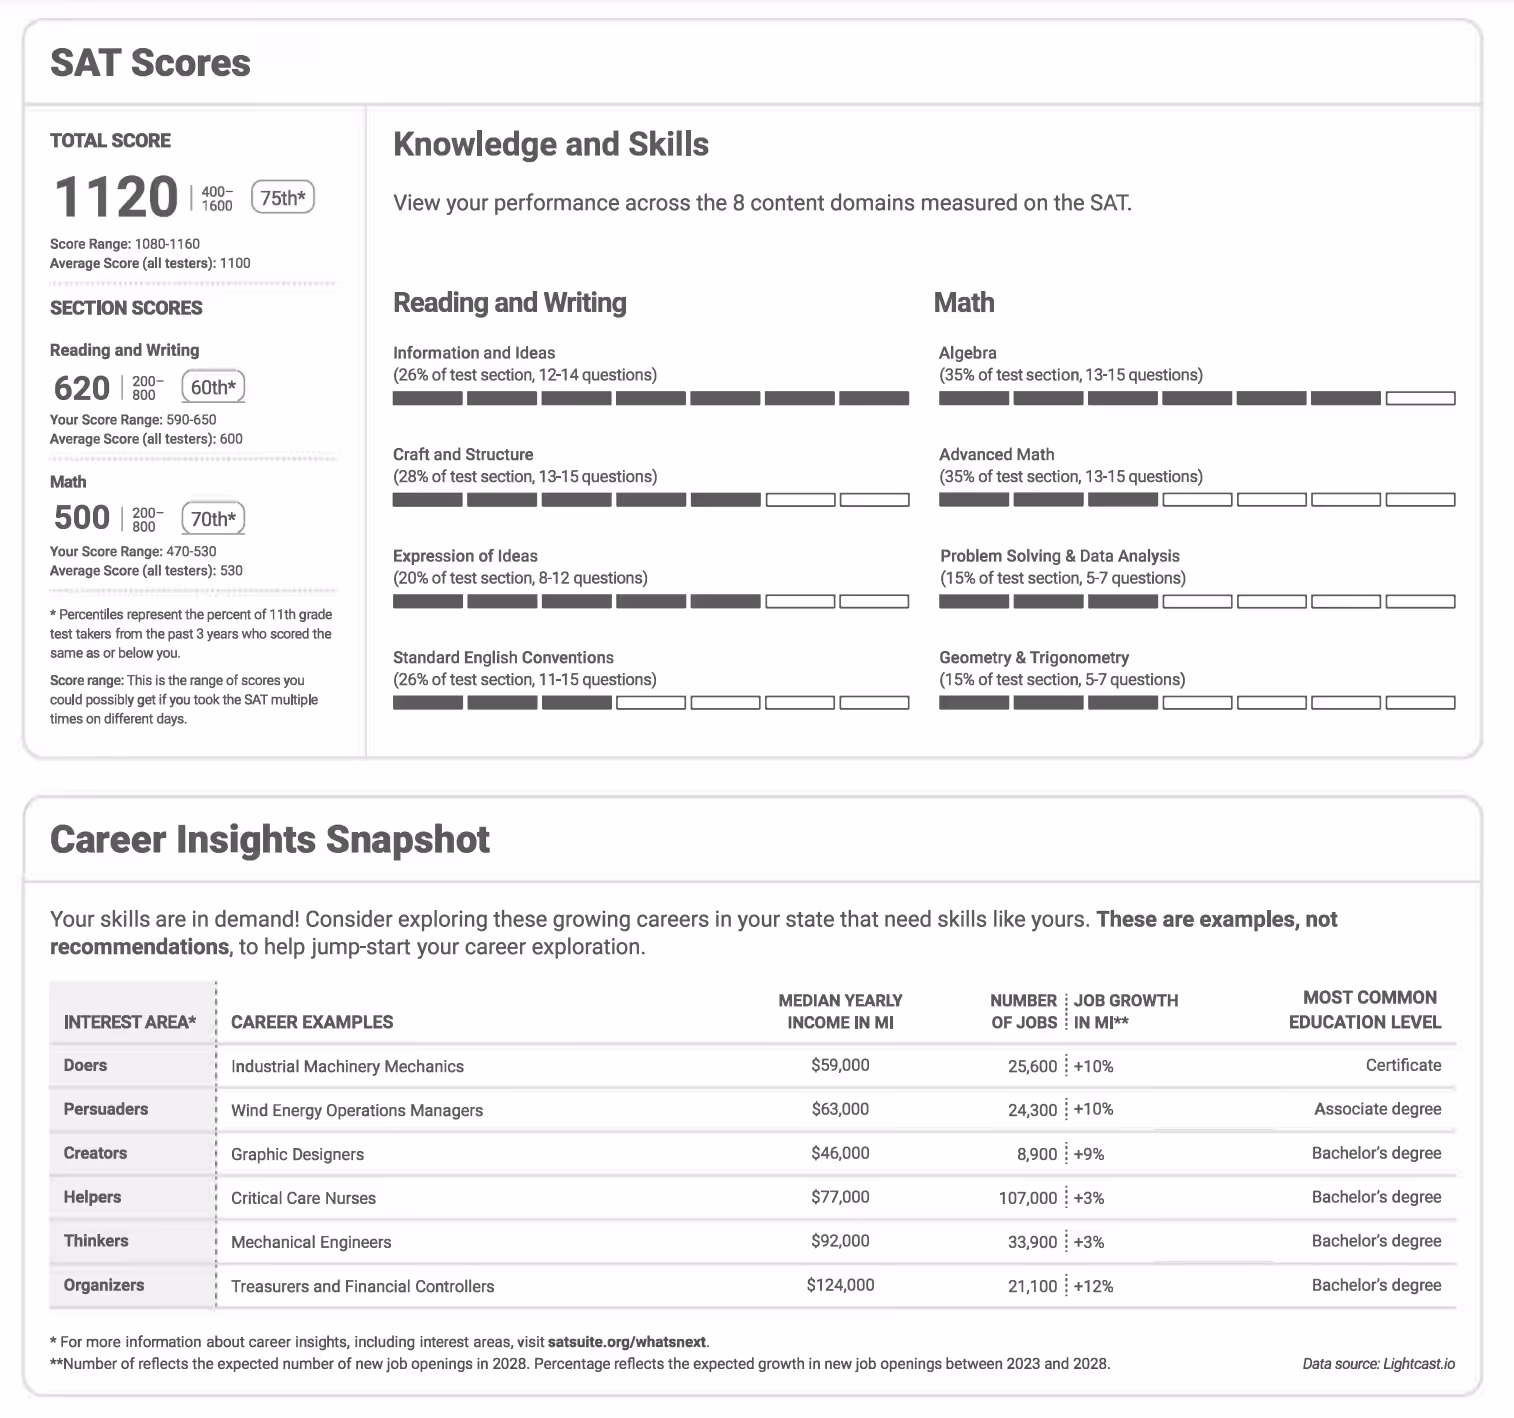
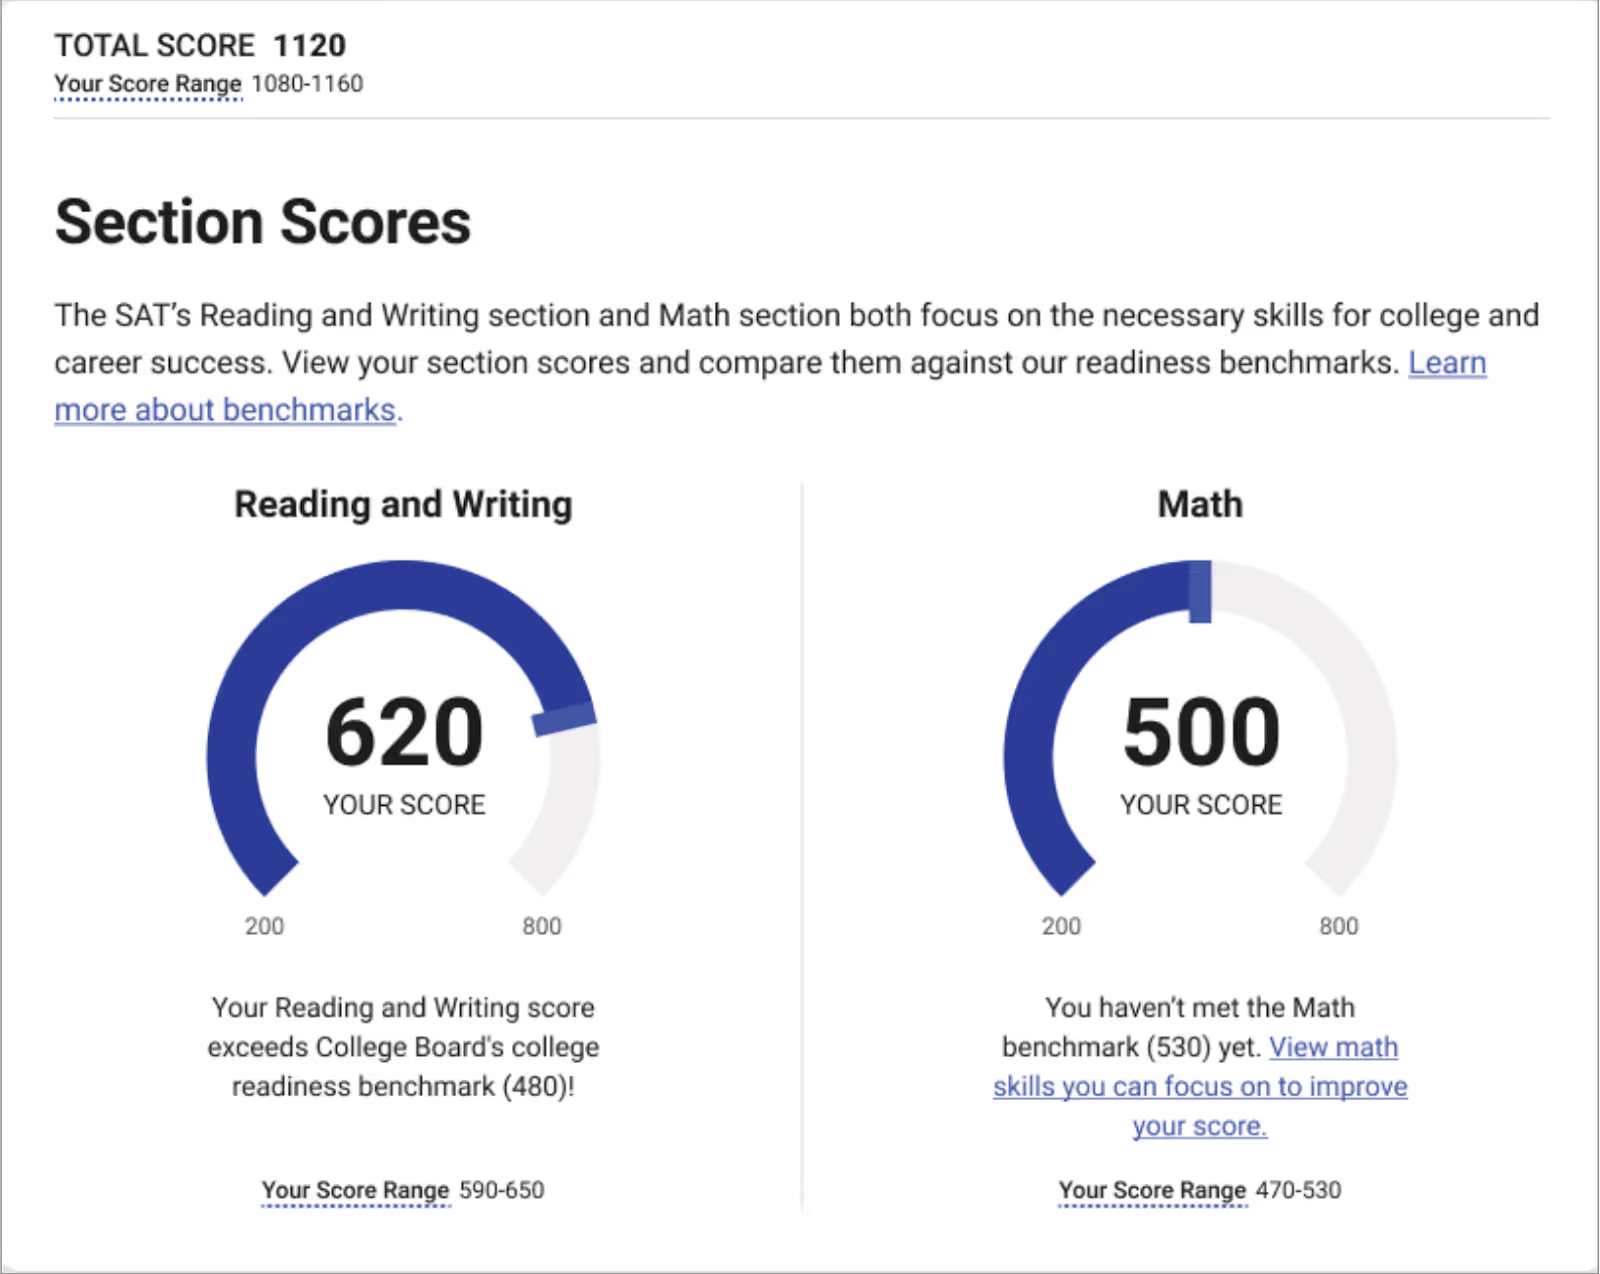
At the top of the report you’ll see your total score. This is simply the total of your scaled scores for the two sections, show right below the total score. You’ll notice they each range from 200 to 800. That way, the total score is between 400 and 1600.
The next part is your percentiles. This shows how you performed compared to other test-takers. For example, a 75th percentile means you scored as well as or better than 75% of students.
You’ll also see college readiness benchmarks for each section. Meeting these benchmarks indicates you are likely prepared for entry-level college coursework in that subject area. Currently, the College Board has set 480 as the benchmark for the Reading & Writing section, and 530 for the Math section (Source).
Finally, you can review your domain-level performance within each section. In Reading & Writing, this includes areas like Craft and Structure or Standard English Conventions. In Math, domains include Algebra and Problem-Solving. These breakdowns help you identify specific strengths, weaknesses, and patterns.
Total Score, Guessing, and Percentiles
Raw scores mean little in isolation, and this is where context, comparison, and scoring rules start to shape what your results actually imply.
Total Scaled Score:
Ranges from 400 to 1600 and is the sum of Reading & Writing and Math scores.
No Penalty for Guessing:
There is no deduction for incorrect answers. Students should attempt every question.
Percentile Rankings:
Percentiles show how your score compares with other test-takers and are central to SAT score interpretation.
What Does Your SAT Score Range Mean?
The maximum you can score in the SAT is 1,600, for which you need to score 800 in each question. Official numbers are not available, but approximately 300 to 500 students achieve this feat every year.
Before we analyse the available data further, we need to understand two terms:
Percentile: Your percentile is the percentage of total test-takers who scored at or below your score. If you are at 84 percentile, it means you performed better than 84% of the total test-takers.
Individual Score Ranges: Your score range is the likely natural variance in your scores if you were to take the SAT multiple times. That’s because the College Board says scores cannot be a single precise figure, and should express the variance (e.g. plus or minus 30 points).
Here’s what the SAT Annual Report 2025 tells us about the 2 million plus students who took the SAT:
The number of students who scored between 1,400 and 1,600: 149,767.
What it means: That’s about 7.49% percent of the total. Students scoring in this range are 93 percentile and above, which is quite a good score. Approximately, a score of 1,350 is what a highly competitive college might require.
The number of students who scored between 1,200 and 1,390: 357,574.
What it means: This figure represents 18% of the total test takers. After adding it to the previous data, it means you are in the 75 percentile and above. That meets the criteria of many good colleges.
The number of students who scored between 1,000 and 1,190: 554,819.
What it means: This figure represents 28% of the total test takers. Because the mean score is 1,029, this will represent 50 percentile and above. Students whose scores fall in this range may find it challenging to get college admissions, and should seriously consider retaking the SAT.
SAT Score Percentiles
As mentioned above, the SAT score percentiles compare your performance with that of other students. Your percentile shows the percentage of test-scores who scored the same as you or lower. For example, 60th percentile means you performed as well as or better than 60% of students.
There are two types of percentiles in your score report. The Nationally Representative Sample Percentile compares your score to all U.S. students of a similar grade level, including those who may not have taken the SAT. That means this is the broader of the two categories.
The SAT User Percentile compares your score only to students who actually took the test, making it more relevant for college admissions context.
The College Board publishes the full official data on SAT percentiles. That covers percentiles for both categories, total scores, and sectional scores. That way, you can see what scores correspond to what scores, and not just own scores.
SAT Subscores and Domain Scores Explained
The SAT scorecard goes beyond merely giving you total or sectional scores. It gives you granular level details. That tells you how you performed in each of the domains (a set of skills) of the section.
Reading & Writing section covers the below domains:
Information and Ideas
Craft and Structure
Expression of Ideas
Standard English Conventions
Math section tests students on the following domains:
Algebra
Advanced Math
Problem-Solving and Data Analysis
Geometry and Trigonometry
Each domain is scored on a scale of 1 to 15. A higher score indicates the student performed better in that domain.
The key use of subscores is to diagnose strengths and weaknesses of the student. It helps the student identify their specific skill gaps within the section. This, in turn, is very useful for targeted prep and study planning. For instance, a student struggling with the R&W section will be able to prepare better when they realize that ‘Standard English Conventions’ is where most of their mistakes lie.
It is important to note that colleges do not use the subscores as a factor in their admission process. Colleges only use sectional and total SAT scores.
You need a detailed breakup and a clear understanding of our performance if you want to make real progress. EdisonOS has developed a special EdisonOS Bluebook insights tool. It is free and will provide you skill-wise and domain-wise insights for the tests you take.
These insights will tell how you’re doing section-wise and where you need to improve.
Career Insights Snapshot: What That Section of the Report Means
While the SAT scores are one of the key factors for your college admission, things don’t end with admissions.
Your report card shows interest areas and some careers most likely associated with that area. For instance, students who are - and love being - organized might be a good fit as treasurers and finance controllers.
The official SAT score report shows such examples, along with:
Median salaries in those jobs
Number of jobs currently available
Annual growth in the number of those jobs, and
The most common education level required for those jobs
Think of it as a career-focused approach to interpreting SAT scores. If you scored high on Reading and Writing, for instance, these examples help you understand where your skills could be best utilized.
However, students need to be clear: “My SAT score report shows examples, but they aren’t suggestions.” The College Board website future careers section offers further help to students in exploring future career opportunities..
What Do Colleges See on Your SAT Score Report?
Let’s say you scored 1,310 on your SAT. But without knowing how to interpret SAT scores from the point of view of colleges, this doesn’t tell you much.
Firstly, colleges view your total scores, but that’s not the only thing they see. Admission committees also see:
Your percentiles
Your section scores
Your subscores, to better understand your strengths and skillsYour test dates
Your score history (covers only those scores that you’ve permitted the College Board to disclose to that particular college)
Your demographic information
Your highschool information
Some universities use the superscore approach - if your score history shows you’ve taken the SAT more than once, the admission committee will use the highest sectional scores to reach your best composite score. Occasionally, a university may insist on seeing your entire score history, although they typically rate you only on the basis of your latest scores.
After this, the college admission committee will combine the above with the other information you might have provided them (e.g. extracurriculars, other course work, credits, etc). This collated data will be then used to compare it with the requirements of the courses you’ve applied for.
What Is a Good SAT Score in 2026?
The mean score of the 2 million plus students who took the SAT in 2025 was 1029, according to the College Board Annual Report we referenced earlier. Fifty-three percent (slightly over half) of the total test-takers scored 1000 or above.
The distribution of percentiles will help you understand this further. If you score 1230, you are in the 80th percentile meaning that only 20 percent of the test-takers have done better than you. A score of 1150 places you in the 70th percentile - you’re ahead of 70 percent of the test-takers.
Now you see that just because 1600 is the highest SAT score possible, it doesn’t mean a lower score of, say, 1290, is of no use for college admissions.
A good score is completely relative and you should frame ‘a good SAT score’ in the context of the college you’re aiming for. A good SAT score is one that meets the college admission requirements, and different colleges have significantly different score requirements.
Does taking the official SAT or ACT early in your prep journey boost your actual scores? Check this blog out.
Keeping the right target score in mind is key to successful preparations. Typical state universities require a score between 1100 and 1200, while most competitive schools look for a score that falls between 1300 and 1400. If you’re targeting a state university, you don’t need to stress yourself by targeting 1390.
Aim for the right score bracket, prepare accordingly, and spend the rest of your time and resources in adding other features (extra-curricular activities, for instance) to you application.
To sum this up, there’s no one single answer to the question ‘what is a good SAT score’. An ivy-league aspirant will find 1320 almost unacceptable, but it could be a great score for someone looking at the next level of colleges.
How to Download Your Digital SAT Score Report
To access your official digital SAT score report, you need a College Board account.
Follow these steps:
Log in to your College Board account
Navigate to the “My SAT” section
Click “View Scores”
Enter your password if prompted
Review and download your score report
Scores are typically released about two weeks after the test date.
Official vs. Practice Test Score Reports: What's the Difference?
Different score reports answer different questions, and tracking the right ones at the right time makes preparation far more intentional.
1. Official SAT Test Report
This is the version of your performance that carries long-term weight. This is the report sent to colleges and used for admissions decisions.
It includes:
Total score out of 1600
Section scores (Reading & Writing, Math)
Percentile rankings
Question-level correctness
Performance trends across attempts
This report helps identify long-term strengths and weaknesses and track improvement over time.
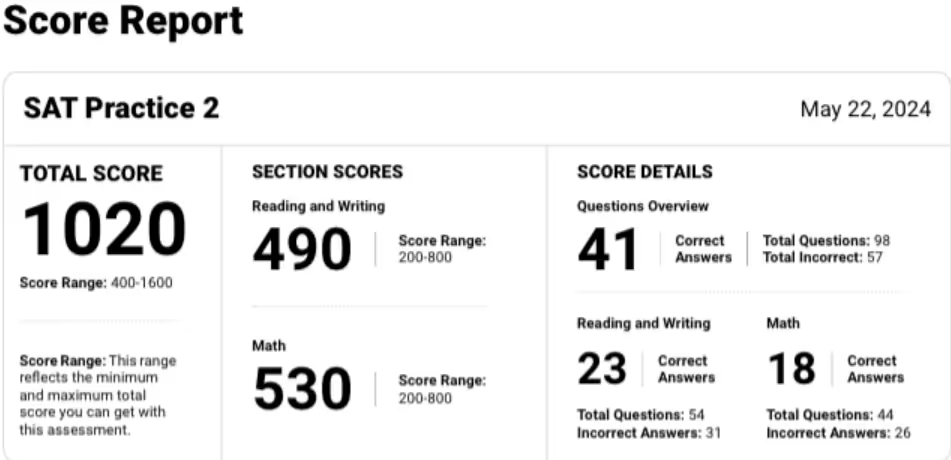
2. SAT Practice Test Report
Digital SAT Practice Test reports exist to guide change, not judgment, and are most useful when read as progress indicators rather than predictions.
It includes:
Estimated total and section scores
Skill-level performance indicators
Correct, incorrect, and skipped responses
Time spent per question
Score progression across tests
Study recommendations
Practice-based SAT score reports are essential for adjusting study strategies before test day.
How to Interpret the Official SAT Score Report
Interpretation is about relationships between numbers, not individual scores, and this section explains how to read those connections correctly.
Total Score (400–1600)
This number gets the most attention, but its meaning depends heavily on how it is reached and how it compares to relevant benchmarks.
Section Scores (200–800 per section)
Breaks down performance between Reading & Writing and Math, helping identify subject-level strengths and weaknesses.
Percentile Rank
Percentiles translate your score into a competitive context, which is often more informative than the score itself.
Two percentile types are reported:
Type
What It Represents
National Percentile
U.S. students in grades 11–12
User Group Percentile
Students who took the SAT in the last three years
How to interpret percentiles:
90th percentile: Scored higher than 90 percent of test-takers
50th percentile: Average performance
10th percentile: Scored higher than 10 percent
Percentiles provide context for competitiveness and are a key part of SAT score interpretation.
College Readiness Benchmarks
Benchmarks connect test performance to real academic outcomes, helping bridge the gap between testing and college expectations. They predict the likelihood of earning at least a C in related college courses.
Section
Benchmark Score
Meaning
Reading & Writing
480+
75 percent chance of college success
Math
530+
75 percent chance of college success
Scores below benchmarks highlight areas needing focused improvement.
[Example: Section Score]
Superscoring and Score Choice: How to Use Your Report Strategically
Your SAT score report can help you make smarter college application decisions, especially if you take the test more than once. Two important policies to understand are superscoring and score choice.
Superscoring means if you’ve taken more than one SATs, the college will look at only your highest score in each section across all your test attempts. These highest sectional scores will be combined to arrive at your aggregate score.
Because of superscoring, many students focus on improving one section at a time rather than trying to maximize both sections in a single test. This can reduce pressure and help create a stronger overall score across multiple attempts.
Score choice allows you to choose which SAT scores to send to colleges. This can be useful if one test date reflects your abilities better than another.
Before sending scores, check each college's admissions policy. Some institutions accept superscores, some allow score choice, and others may require all SAT scores. Understanding these policies can help you present the strongest application possible.
Score choice gives students greater control over their applications by allowing them to highlight their stronger performances. However, it is important to verify each college's policy, as some schools require applicants to submit all SAT scores from every test date.
How to Use Your Bluebook Practice Test Report
Practice test reporting is where most score movement happens, provided the data is read with the right intent.
Bluebook Practice Test Report
Bluebook reports are a starting point, useful for orientation but limited in how far they can guide improvement.
Receiving your SAT scores feels like the culmination of all your efforts. You might even feel there isn’t much left to do now. However, that’s not true.
The first thing you’ll need to do is to evaluate your scores in the correct context. As explained earlier, a score can be seen as good or inadequate only with reference to what your dream college requires.
Even if you’re reasonably sure what college you’d like to get into, the College Board’s College Search tool is a great place to check. You’ll see a lot of important information related to colleges. This will help you make a more informed decision.
Image source: College Board
After this exercise, you can decide if your scores meet your goals or whether you need to retake the SAT. The College Board officially states that “Most students get a higher score the second time...”. This shows that if your current scores aren’t what you wanted, a re-take could make a lot of sense.
If you're unsure whether to retake, you have got data-backed help. EdisonOS can provide you with your skill trend data across practice tests. It will show whether you're on an improvement trajectory or have plateaued. Instead of going by mere gut-feeling, you can make an informed decision.
Also look at your domain scores. They will clearly tell you what you need to prioritize during the SAT prep. To make this more effective, consider taking a free SAT diagnostic test. In addition to the free SAT diagnostic test, EdisonOS offers 22 full-length practice tests. Scores of these 22 full-length practice tests are tracked in EdisonOS, so that you can see the entire prep arc, and not just your most recent test.
It has a 40% faster student improvement curve, which shows how effective this approach is.
Bluebook vs EdisonOS: SAT Score Report Comparison
Here is how Bluebook and EdisonOS differ when it comes to comparing two SAT score reports:
Feature
Bluebook
EdisonOS
Total & Section Scores
Yes
Yes
Correct vs Incorrect Analysis
Yes
Yes
Difficulty-Level Breakdown
No
Yes
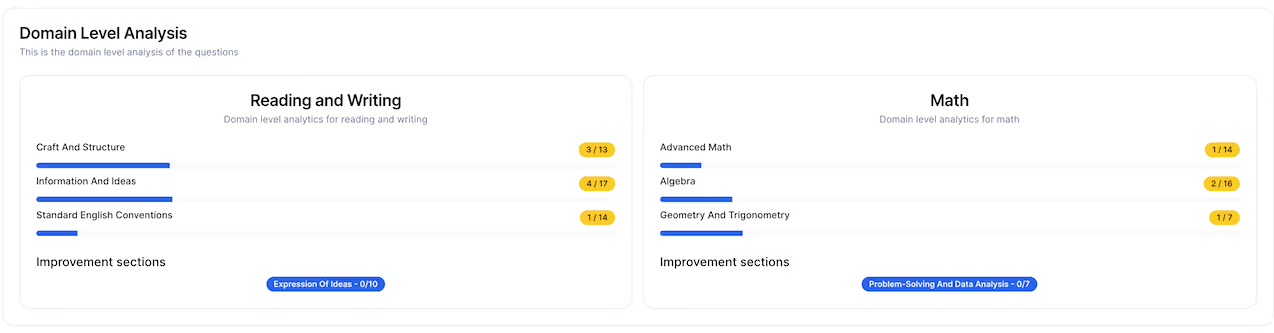
Domain-Wise Performance
No
Yes
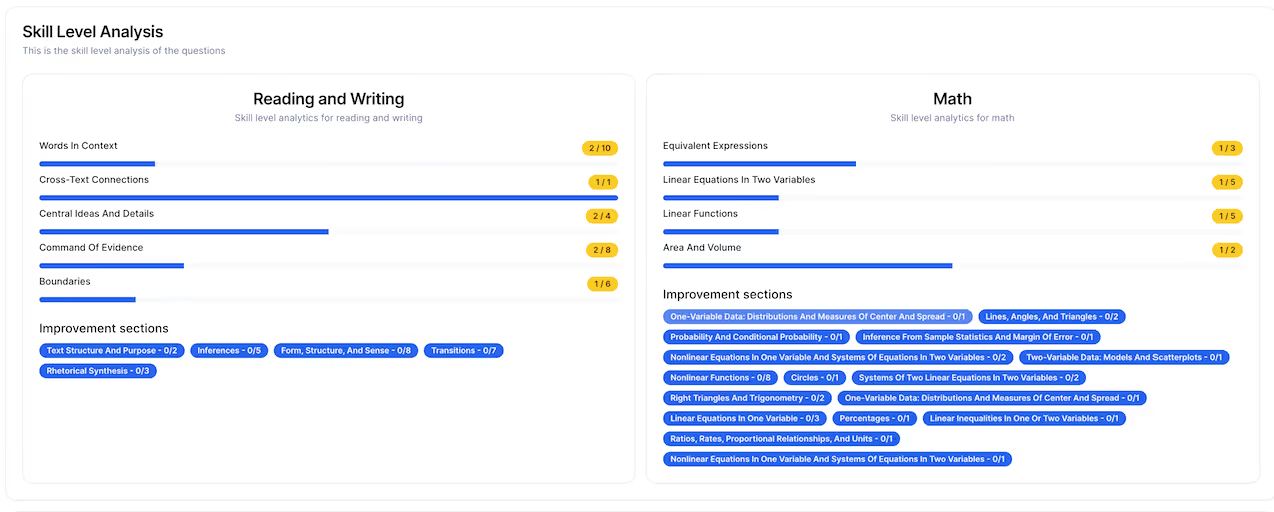
Skill-Wise Analysis
No
Yes
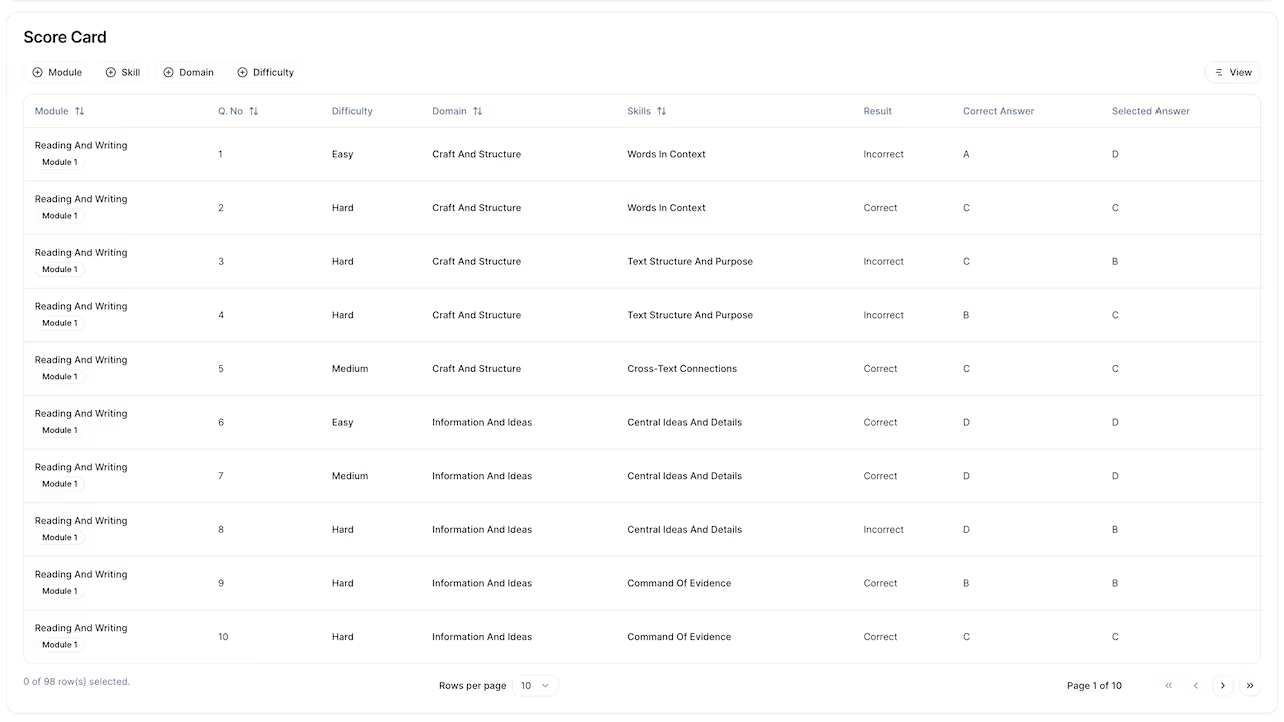
Question-Wise Review
No
Yes
Strategic Insights
No
Yes
How EdisonOS Helps You Get More from Your SAT Score Data
EdisonOS is where score interpretation becomes a feedback loop, shaping how preparation evolves over time. See how the platform helps you prepare effectively for the Digital SAT:
Detailed Progress Tracking: EdisonOS offers comprehensive insights into student performance, helping tutors pinpoint areas of strength and weakness. This enables focused improvements and well-informed instruction strategies.
Advanced Tools for Preparation: The platform provides diagnostic assessments, full-length mock exams, sectional tests, and the largest SAT question library. Multi-stage adaptive testing ensures an accurate representation of student progress and readiness. This is an important feature to bear in mind when you compare digital SAT test providers.
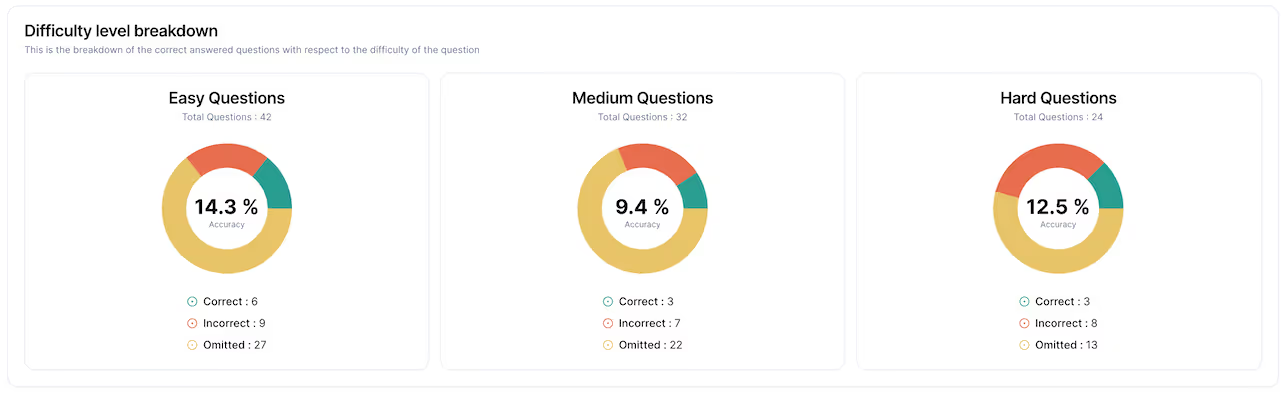
Performance by difficulty: Bluebook shows you a simple breakdown of what questions you got wrong. EdisonOS, on the other hand, does the analysis of what really contributes to a better score. It shows you your performance across each difficult level. This helps you fine-tune your pacing strategy. More mistakes with the easier questions, for instance, point toward haste while more mistakes with the difficult questions could suggest a weaker grasp of the fundamentals.
Skill trends over time: Bluebook shows you what you scored in this test, but nothing beyond that. EdisonOS tracks your performance across multiple practice skill. This will show how your scores have grown (or stagnated) over time.
Scaled score comparison: Bluebook will restrict itself to reporting your current performance. EdisonOS can take a broader view by displaying and tracking how you did across 22 practice tests.
Data-Driven Decision Making: With detailed analytics, tutors can plan lessons, adjust pacing, and allocate resources effectively based on individual performance metrics.
Personalized Feedback: Feedback reports generated by EdisonOS highlight specific areas for improvement and recommend focused study strategies for students, ensuring continuous progress.
Proactive Learning Gap Identification: Comprehensive reports allow tutors to identify and address gaps early, ensuring students grasp foundational concepts before moving on to advanced material.
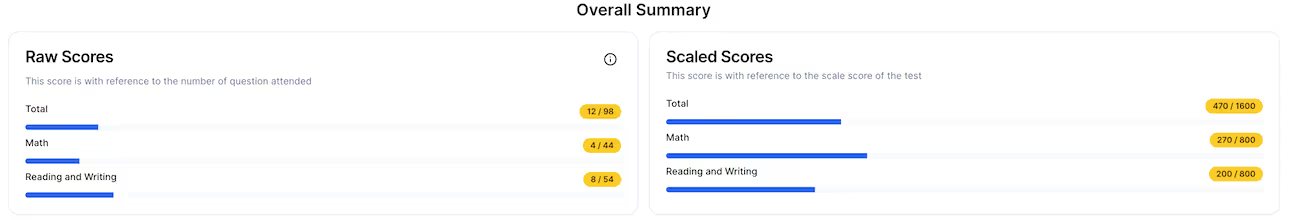
How to Generate an Advanced Digital SAT Score Report Using EdisonOS
Click “Score Details” on any practice tests you took in the past for which you need to generate the advanced analytics report.
Right-click on any non-text area and click Save as (Use only Chrome Browser)
In the Pop-up, Select Format as “Web Page, Complete” and click Save in the desired location.
Now, download the Score Report as well
Save the Score Report PDF in the desired location
Next, go to EdisonOS’s BlueBook Insights Page and upload the downloaded HTML in the first upload, then the Scorecard
Enter a valid email where you would like to receive the URL to access the report and hit the Get Your Report button.
You get an insightful report generated for your practice test attempted on the BlueBook App
EdisonOS equips tutors with the tools and insights necessary for structured and effective SAT preparation, creating opportunities for students to reach their full potential.
Frequently Asked Questions
What is a Digital SAT Scoring Report?
What does my total SAT score mean?
How are my section scores broken down?
What is a good SAT score?
How to access your SAT score report?
What are SAT subscores and how do I use them?
ABOUT THE AUTHOR
Mayank Batavia
Content Strategist
Mayank Batavia is a freelance content strategist and content writer who writes mostly for tech companies. His background in coaching helps him study and analyse training systems and solutions. He loves memorizing trivia, watching old Westerns, and trying NYT crosswords that he can rarely solve.
Tutors Edge by EdisonOS
Get Exclusive test insights and updates in our newsletter, curated to help tutors stay ahead!
Thanks for subscribing! The 'Digital SAT Breakdown Report' has reached your inbox!
Oops! Something went wrong while submitting the form.


.png)
.webp)
