Mastering Desmos as a tutor comes down to teaching core tools like function notation, sliders, and regression analysis, focused on core graphing, data tables, and verification techniques.
- Function notation — Define terms like f(x) = 2x + 3 to evaluate points or apply quick transformations.
- Sliders — Type an unknown coefficient with a letter (like y = mx + b) to prompt a dynamic slider for tracking variables.
- Tables and regression — Input coordinate pairs into a table and use commands like y1 ~ mx1 + b to find lines of best fit instantly.
- The golden rule — Teach the underlying math first, and use Desmos to verify work rather than replace conceptual understanding.
- Intersection method — Solve systems of equations by graphing both sides separately and clicking the intersection points.
- Zero-equal trick — Rearrange complex single-variable equations to equal zero so students can read the roots directly from the x-intercepts.
The Digital SAT is nearly 25% shorter than the previous paper test, giving students just 2 hours and 14 minutes to complete the exam. So, every minute counts.
The built-in Desmos SAT Calculator can help you solve many math questions faster and more accurately, but only if you know how and when to use it.
In this guide, you'll learn:
- How to use the Desmos SAT Calculator during the Digital SAT
- Which SAT Math questions are best solved using Desmos
- When solving manually is faster than graphing
- Practical Desmos shortcuts that save valuable time
- Strategies tutors can use to help students build confidence before test day
Whether you're preparing for your own exam or teaching Digital SAT Math, this guide will help you make the most of one of the most powerful tools available on test day.
Types of SAT Math Questions You Should Solve Using Desmos
The Digital SAT includes the Desmos graphing calculator throughout the Math section, but that doesn't mean every question should be solved with it. Here are the problem types where graphing is faster and more reliable than manual calculations:
1. Solving Linear Equations
Teach students to use Desmos when questions involve finding intercepts, comparing multiple linear equations, or interpreting graphs. It's particularly useful for verifying answers and solving graph-based questions quickly.
Quick Desmos workflow
- Enter the equation exactly as written.
- Graph the line.
- Click the x-intercept or y-intercept, or compare multiple graphs.
Why it saves time: Instead of rearranging equations or solving manually, students can visualize the relationship immediately. It also provides a quick way to verify algebraic solutions before selecting an answer.
SAT example:
Suppose a question asks students to find the x-intercept of y = 2x - 6. Rather than solving for x, they can graph the equation and click the intercept directly.
Tutor tip: Avoid positioning Desmos as a replacement for algebra. Have students solve the first few questions manually, then use Desmos to verify their work. This builds conceptual understanding while introducing an efficient checking strategy.
2. Solving Systems of Equations
Students should use Desmos when a question asks them to find the point where two equations intersect or determine whether a system has one solution, no solution, or infinitely many solutions. It's especially useful for graph-based and real-world application questions.
Quick Desmos workflow
- Enter both equations exactly as given.
- Graph them on the same coordinate plane.
- Identify the point where the graphs intersect.
- Read the coordinates directly from the graph.
Why it saves time: Graphing eliminates several algebraic steps and reduces common mistakes such as incorrect substitution or sign errors. It also gives students an immediate visual confirmation of their solution.
SAT example
Suppose students are given the system:
- y = 2x + 3
- y = -x + 6
Instead of solving the equations algebraically, they can graph both lines and click the intersection point to find the solution.
Tutor tip: Teach students to recognize when graphing is the faster option. After finding the intersection in Desmos, have them substitute the coordinates back into both equations to verify the answer. This reinforces the mathematical concept while helping them build confidence in using Desmos strategically.
3. Solving Systems of Inequalities
Students can use Desmos when questions ask them to determine which points satisfy multiple inequalities, identify feasible regions, or analyze constraints in real-world scenarios. It's particularly effective for questions involving linear programming concepts and graph interpretation.
Quick Desmos workflow
- Enter each inequality exactly as written.
- Observe the shaded region for each inequality.
- Identify the overlapping area that satisfies all conditions.
- Check whether the given point or answer choice falls within the feasible region.
Why it saves time: Students no longer need to manually graph boundary lines or determine which side of the line to shade. Desmos does the visualization instantly, allowing them to focus on interpreting the solution instead of constructing the graph.
SAT example
Suppose students need to determine which point satisfies the following system:
- y ≥ 2x - 1
- y < x + 3
By graphing both inequalities in Desmos, they can immediately identify the overlapping region and determine which answer choice lies within it.
Tutor tip: Many students confuse solid and dashed boundary lines or shade the wrong side of an inequality. Before introducing Desmos, ensure they understand what each inequality represents. Then use the graph to reinforce the concept rather than replace it. This helps students develop stronger intuition for inequality problems while improving their speed on the Digital SAT.
4. Finding X- and Y-Intercepts
Use Desmos when students need to identify the x-intercepts (zeros) or y-intercept of a function, compare graphs, or interpret where a graph crosses an axis. It's particularly helpful for quadratic, polynomial, and exponential functions where manual calculations can be time-consuming.
Quick Desmos workflow
- Enter the function into Desmos.
- Graph the equation.
- Click the x- and y-intercepts displayed on the graph.
- Read the coordinates directly.
Why it saves time: Instead of factoring polynomials or solving equations manually, students can identify intercepts instantly. It also serves as an excellent verification tool when they've already solved the problem algebraically.
SAT example
Suppose students are asked to find the x-intercepts of y = x² - 5x + 6. Rather than factoring the quadratic, they can graph the function in Desmos and click both intercepts to identify the solutions.
Tutor tip: Teach students what intercepts represent before introducing Desmos. For example, explain that x-intercepts are the values where y = 0, while the y-intercept is the value of y when x = 0. Once they understand the concept, Desmos becomes a tool for solving and verifying, not replacing the underlying mathematics.
5. Finding the Vertex of Quadratics
Students can identify the vertex of a quadratic, determine the maximum or minimum value of a function, analyze transformations, or compare multiple parabolas with Desmos. It's especially helpful for questions that emphasize graph interpretation over algebraic manipulation.
Quick Desmos workflow
- Enter the quadratic equation into Desmos.
- Graph the parabola.
- Click the vertex to display its coordinates.
- Use the graph to identify whether the parabola opens upward or downward and locate its axis of symmetry.
Why it saves time: Students can identify the vertex without applying the vertex formula or completing the square. This reduces calculation errors and helps them quickly verify whether their algebraic solution is correct.
SAT example
Suppose students are given the function y = -x² + 4x + 5 and asked to find its maximum value. By graphing the equation in Desmos, they can click the vertex to identify both the maximum value and the point where it occurs.
Tutor tip: Don't let students rely on Desmos as a shortcut. After locating the vertex on the graph, ask them to explain why it represents the maximum or minimum value and relate it to the equation. Connecting the graph with the algebraic form helps students recognize quadratic patterns even when they choose not to use Desmos.
SAT Math Problems Where Desmos Helps, but Isn't Always the Best Option
Not every SAT Math question needs Desmos. In some cases, graphing can help students visualize a problem or verify an answer, and in others, solving it manually is faster. For example:
- Equivalent Expressions: Desmos can help students verify whether two expressions produce the same output by graphing them or testing multiple values. However, for straightforward simplification or factoring questions, algebra is usually the quicker option.
- Certain Quadratic Questions: When students need to find the vertex, roots, or graph of a quadratic, Desmos provides a fast visual solution. But if the question asks students to factor an expression, identify coefficients, or rewrite an equation in a specific form, solving it manually is often more efficient.
- Function Transformations: Desmos is an excellent teaching tool for demonstrating shifts, reflections, stretches, and compressions. Once students understand these patterns, however, they should learn to recognize transformations without relying on the graph during every practice question.
- Slider-Based Problems: Sliders help tutors show how changing coefficients affects a graph, making abstract concepts easier to understand. Since students won't use sliders during the Digital SAT, treat them as an instructional aid rather than a test-taking strategy.
Rather than teaching students to use Desmos for every question, help them recognize the situations where it improves speed and accuracy.
SAT Math Problems You Should NOT Solve Using Desmos
Desmos is one of the most valuable tools on the Digital SAT, but it isn't the right tool for every question. Let’s see where:
Tutors should encourage students to pause before opening the calculator and ask a simple question: Will graphing save time, or will it create extra work?
That habit alone can improve both pacing and accuracy on the Digital SAT.
Why Every Digital SAT Student Should Learn Desmos
College Board built a graphing calculator directly into the Bluebook app to allow students to use it throughout the entire Math section. Its goal is simple: to test your student’s mathematical reasoning, not calculator speed or access to expensive graphing devices.
Here’s why your students need to learn to use Desmos:
- Save Time on Every Math Module: The Digital SAT gives 70 minutes to answer 44 Math questions, or about 1 minute and 35 seconds per question. Desmos can solve many problems in just a few clicks, helping students spend less time on calculations and more time on challenging questions.
- Improve Accuracy: Small algebra or arithmetic mistakes can cost valuable points. Desmos helps verify solutions by graphing equations, checking intersections, and testing answers visually. Instead of relying solely on manual calculations, your students can confirm whether their solution makes sense before moving on.
- Solve Problems Visually: Linear equations, systems of equations, quadratics, inequalities, and functions often reveal their answers through visual patterns that are difficult to spot using algebra alone. Graphing these relationships can reduce guesswork and increase confidence.
- Reduce Algebra Mistakes: Even students who understand the underlying concepts lose points because of sign errors, incorrect substitutions, or calculation slips. Desmos handles the computation, allowing them to focus on interpreting the results instead of worrying about lengthy algebra.
Teach Desmos Before Advanced SAT Strategies
Advanced pacing strategies won't help if students struggle with the calculator they'll use on test day. By introducing Desmos early, tutors can help students build confidence with the tool first, then focus on higher-level test strategies, question selection, and time management. College Board also encourages students to practice with the built-in Desmos calculator before taking the Digital SAT.
How to Access the Desmos Calculator During the Digital SAT
The Desmos SAT Calculator is built directly into the College Board's Bluebook testing app. Students can access it throughout both Math modules, so there's no need to switch devices or use a separate graphing calculator. While students may also bring an approved handheld calculator, learning the built-in Desmos interface prepares them for the exact testing experience.
Understanding the Desmos Interface
The Digital SAT uses a simplified version of the Desmos Graphing Calculator. Before introducing SAT strategies, tutors should ensure students are comfortable navigating the interface.
Key components include:
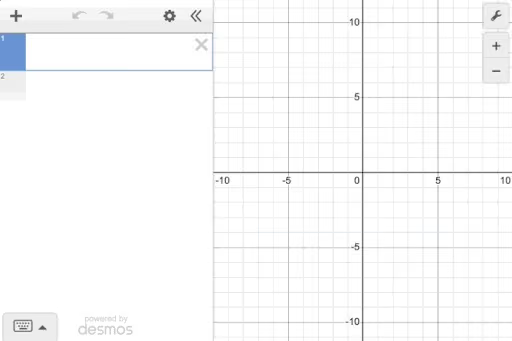
- Expression panel: Located on the left, this is where students enter equations, inequalities, tables, and functions.
- Graph window: Located on the right, it displays graphs instantly and allows students to identify intercepts, intersections, vertices, and other key points.
- Toolbar: Provides tools for zooming, adjusting graph settings, clearing expressions, and switching between graphing and scientific calculator modes when needed.
A few minutes spent familiarizing students with these features can prevent unnecessary hesitation during the exam.
No Account Required
Students don't need to create a Desmos account or sign in during the Digital SAT. The calculator is fully integrated into Bluebook and is ready to use as soon as the Math section begins. Tutors should encourage students to practice with the embedded calculator in official Bluebook practice tests so the interface feels familiar on test day.
Essential Desmos Features Every SAT Student Should Master
The Digital SAT includes the Desmos graphing calculator throughout the Math section, but students don't need to master every feature. Instead, tutors should focus on the tools that appear most often in SAT Math questions and help students solve problems more efficiently.
Graphing Equations
Graphing equations is the most important Desmos skill for the Digital SAT. Tutors should teach students to graph linear, quadratic, exponential, and absolute value functions, then identify intercepts, vertices, and intersections directly from the graph.
This helps students connect equations with their visual representations instead of relying only on algebra.
For example, if an SAT question asks students to find the x-intercepts of y = x² − 5x + 6, they can graph the function and click the intercepts instead of factoring the quadratic. Encourage students to use graphing to verify answers and solve graph-based questions more efficiently.
Tables
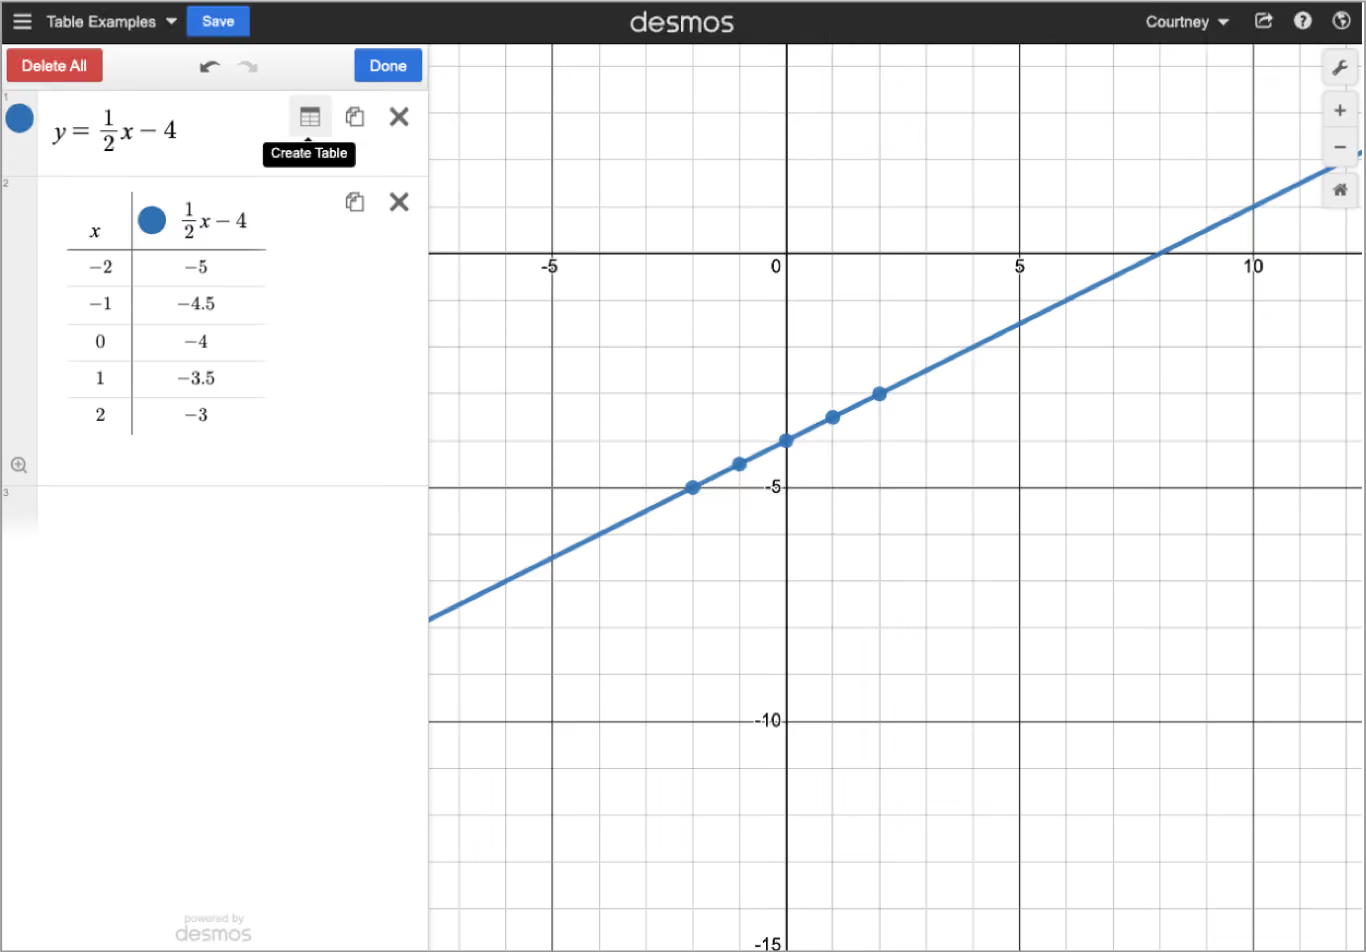
Tables help students connect numerical patterns with graphs, making them useful for function and data analysis questions on the Digital SAT. Tutors can use tables to show how changes in input values affect a function before introducing the corresponding graph.
For example, if an SAT question asks students to identify a pattern or evaluate a function for different values of x, creating a table in Desmos helps them visualize the relationship quickly. Once students recognize the pattern, they can move seamlessly between tables, equations, and graphs.
Sliders
Sliders help tutors explain how changing a coefficient affects a graph. While students won't use sliders during the Digital SAT, they are an excellent teaching tool for building intuition around function transformations before students solve similar questions independently.
For example, use sliders to demonstrate how changing a in y = ax² makes a parabola wider, narrower, or opens it upward or downward. Once students understand these patterns visually, they're much faster at answering transformation questions on the SAT without relying on Desmos.
Regression lines of best fit
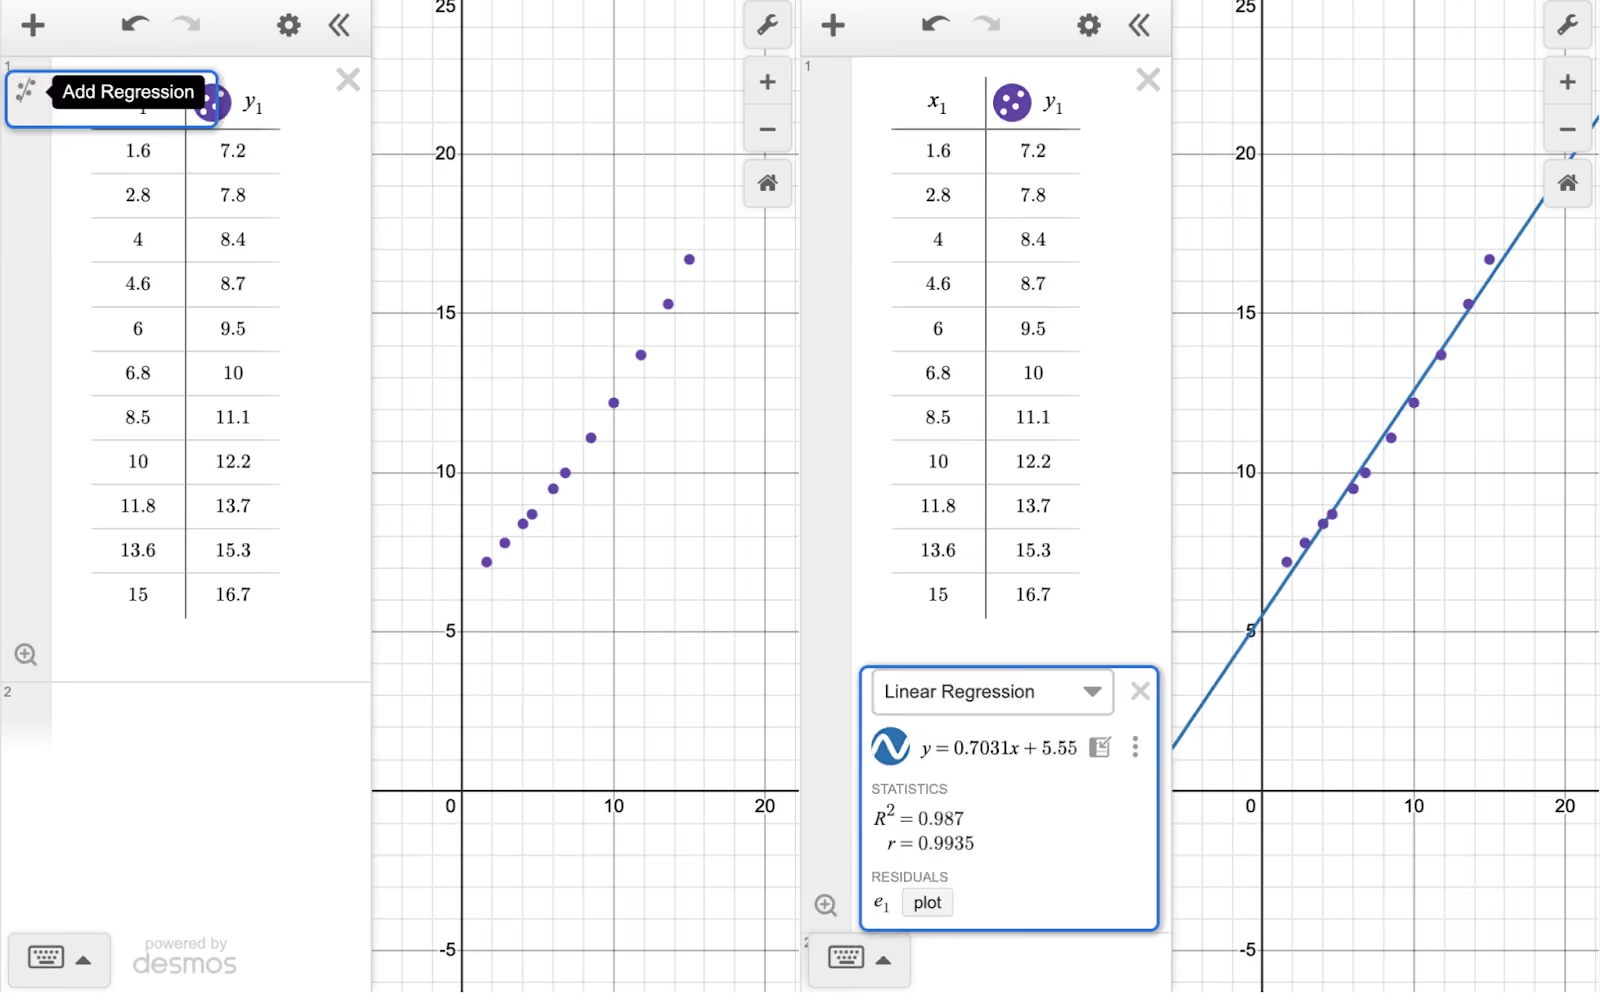
Regression helps students model relationships between data points by fitting a line or curve to a scatter plot. While it isn't tested frequently, it's a useful feature for SAT questions involving data analysis, trends, and real-world modeling.
For example, if students are asked to identify the line of best fit for a set of data, Desmos can generate a regression model in seconds.
Tutors should introduce this feature after students understand how to interpret scatter plots and recognize patterns in data.
Graph Settings
Students should know how to zoom, pan, and reset the graph window to view functions clearly. An improperly scaled graph can hide important features such as intercepts, vertices, or intersections, leading to incorrect interpretations.
For example, if an SAT question involves a quadratic with large values, adjusting the graph window can make the vertex and x-intercepts visible. Tutors should encourage students to check the graph scale before drawing conclusions from what they see.
Intersections
Finding intersections is one of the biggest advantages of using Desmos on the Digital SAT. Instead of solving systems of equations manually, students can graph multiple equations and identify the solution by clicking the point where the graphs intersect.
For example, if an SAT question asks students to solve a system of linear equations, graphing both lines often produces the answer in seconds. Tutors should teach students to use intersections strategically for graph-based questions while verifying the result algebraically when needed.
Statistical functions
Desmos includes built-in statistical functions such as mean(), median(), and standard deviation(), helping students analyze data more efficiently. Tutors can use these tools to reinforce statistical concepts while reducing time spent on manual calculations.
For example, if an SAT question asks students to compare two data sets or determine a measure of center, Desmos can calculate the values instantly. This allows students to focus on interpreting the results instead of performing lengthy computations.
Domain and Range
Understanding domain and range helps students interpret functions rather than simply graph them. Tutors can use Desmos to show how a function's graph reveals its valid inputs (domain) and possible outputs (range), making these concepts more intuitive.
For example, if an SAT question asks for the range of a quadratic or the domain of a square root function, students can use the graph to visualize where the function exists and how far it extends. This helps reinforce the connection between algebraic expressions and their graphical behavior.
10 Desmos SAT Shortcuts That Save Time
These shortcuts can save valuable time during the Digital SAT while reducing unnecessary calculations.
- Click intersections instead of solving systems manually. Graph two equations and click their intersection to solve systems of equations in seconds instead of using substitution or elimination.
- Evaluate functions instantly: Type expressions like f(3) or substitute values directly into an equation to verify answers without manual calculations.
- Convert decimals into fractions: Click the result and switch between decimal and fractional forms whenever the SAT requires an exact answer.
- Use mean() and median() for statistics questions: Instead of calculating measures of center manually, use the built-in functions to analyze data sets instantly.
- Create tables to spot patterns: Tables make it easy to identify function values, sequences, and input-output relationships, especially in function questions.
- Use regression for line-of-best-fit questions: Enter data into a table and apply a regression model to generate the best-fit equation for data analysis problems.
- Click graph labels instead of estimating: Desmos automatically labels intercepts, vertices, and intersections. Clicking these points provides precise coordinates without additional calculations.
- Adjust the graph window before solving: Zooming or resetting the graph often reveals hidden intercepts or turning points that aren't visible in the default view.
- Use sliders to understand transformations: During tutoring sessions, sliders help students visualize how changing coefficients affects a graph, making function transformations easier to understand before test day.
- Type math symbols instead of searching the keypad: Speed up input by typing shortcuts such as sqrt for √, ^ for exponents, <= or >= for inequalities, and / for fractions instead of selecting them from the on-screen keypad.
Leveraging Desmos Classroom activities
Desmos Classroom activities allow you to move beyond demonstration by giving students structured, interactive tasks that reveal their thinking in real time.
What is Desmos Classroom
The Amplify Classroom, formerly the Desmos Classroom, is an interactive teaching platform built on top of Desmos’s visualization tools. It allows you to assign activities where students interact with mathematical ideas directly on their screens, rather than watching demonstrations.
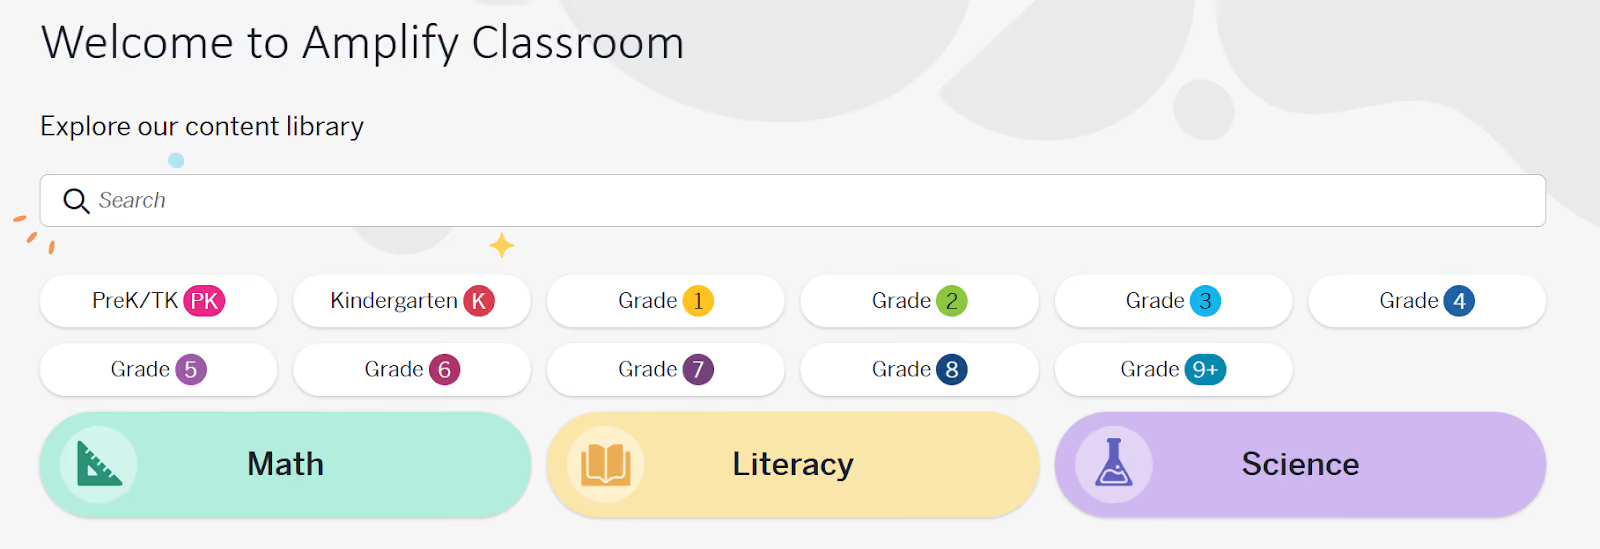
Unlike the graphing calculator, which is primarily an individual tool, Desmos Classroom is designed for guided learning. You control the activity flow, while students engage with prompts, graphs, and tasks that reveal how they are thinking.
This means you can see process, not just the final answers.
How tutors can use pre-made activities for 1:1 sessions
Most Desmos Classroom activities are designed for classrooms, but they adapt extremely well to one-on-one tutoring when used intentionally.
In a 1:1 session, you can assign an activity and have the student work through it independently for a few minutes. While the student works, you observe their responses through the dashboard instead of interrupting them constantly. This gives you insight into how they approach problems when left on their own.
You can then pause the activity and discuss specific screens. This makes feedback more targeted and productive, because you are responding to what the student actually did, not what you assume they understood.
Pre-made activities are especially useful when:
- Introducing a new concept visually before formal instruction
- Diagnosing misconceptions without direct questioning
- Encouraging students to explain their thinking in words or graphs
Used this way, Desmos Classroom becomes a diagnostic and teaching tool, not just practice.
Popular activity types and how to use them effectively
Desmos Classroom includes several activity formats, each serving a different instructional purpose.
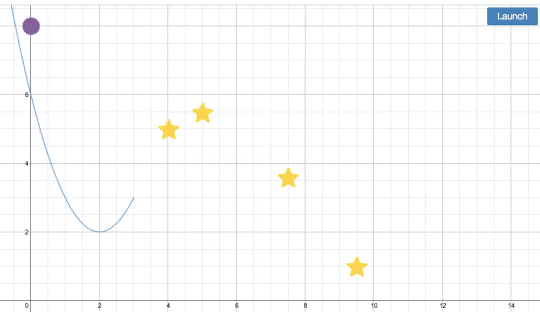
Marbleslides
Marbleslides ask students to graph functions that guide a marble to a target. This format is excellent for building intuition around slope, intercepts, and curve behavior.
Marbleslides works best when you ask students to predict what kind of equation might work before they start adjusting graphs. After completion, review the student’s approach rather than just the final graph.
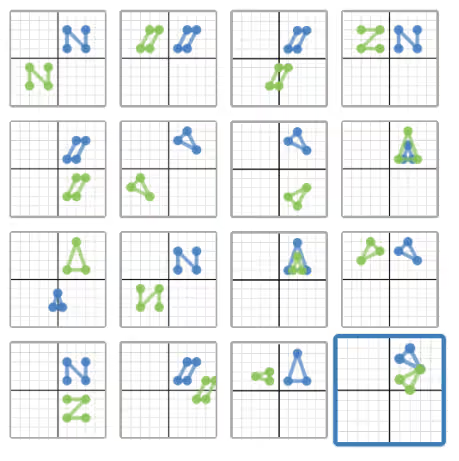
Polygraphs
Polygraphs are designed to develop precise mathematical language. Students ask yes-or-no questions to identify a graph from a set of possibilities.
Polygraphs are especially valuable for students who struggle to describe graphs accurately. They surface gaps in vocabulary and understanding, such as confusion between “increasing” and “positive” or “steep” and “vertical.”
Card Sorts
Card Sorts require students to match representations, such as equations, graphs, and descriptions.
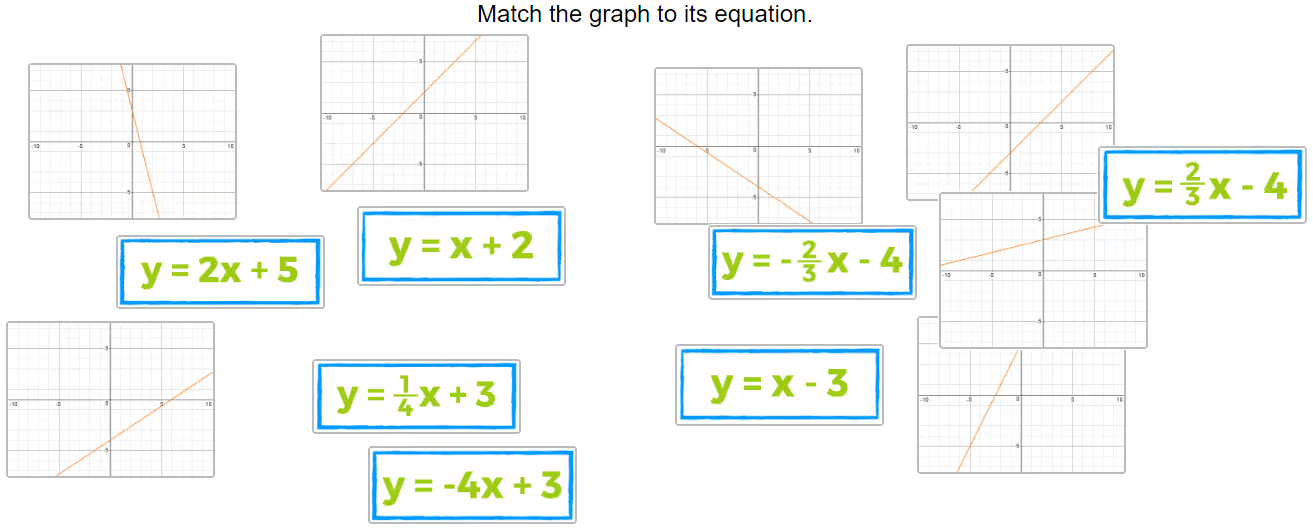
These activities are ideal for reinforcing connections between algebraic and graphical forms. In a 1:1 setting, you can ask students to explain why they made each match, which reveals depth of understanding far better than multiple-choice questions.
Using the Teacher Dashboard to monitor student progress
The Teacher Dashboard is one of the most valuable features of Desmos Classroom for tutors.
As students work through an activity, the dashboard updates in real time. You can see:
- Which screen the student is on
- Their responses and graphs
- Patterns in their mistakes or misconceptions
In a tutoring context, this allows you to decide when to step in and when to let the student struggle productively. Instead of hovering or guessing, you intervene based on evidence.
The dashboard also helps you identify whether an issue is conceptual, procedural, or language-based, which informs your next teaching move.
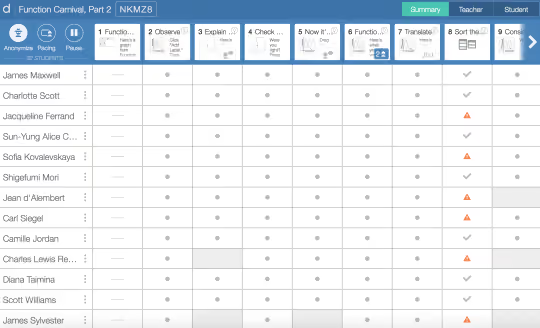
The Teacher Dashboard allows you to monitor student progress in real time. You can also create and customize activities using the Activity Builder to target specific learning goals.
Creating and customizing activities with Activity Builder
While pre-made activities cover many topics, the Activity Builder allows you to create or customize activities tailored to your students.
With the Activity Builder, you can:
- Modify existing activities to match your teaching sequence
- Remove unnecessary screens for focused sessions
- Add reflection prompts or explanation questions
- Design activities around specific SAT or curriculum skills
You can align activities directly with a student’s weak areas or upcoming assessments, making sessions more efficient and targeted.
Over time, building a small library of customized activities allows you to reuse effective lessons across multiple students without starting from scratch.
Why Desmos Classroom matters for tutors
Desmos Classroom shifts tutoring from explanation-driven to learning-driven instruction. It helps you observe thinking, guide exploration, and address misconceptions early.
When used thoughtfully, it supports deeper understanding, stronger engagement, and better retention. For tutors who want students to think rather than imitate, Desmos Classroom is a powerful addition to the tutoring toolkit.
Desmos tips and best practices for tutors
- Teach graph interpretation, not just button clicks. Help students explain what intercepts, vertices, and intersections mean instead of simply identifying them.
- Ask students to predict before graphing. Encourage them to estimate the graph's shape or solution first, then use Desmos to verify their reasoning.
- Practice with Bluebook. Have students use the built-in Desmos calculator in official Bluebook practice tests so the interface feels familiar on test day. College Board recommends practicing in the actual testing environment.
- Develop Desmos-first strategies. Teach students which SAT question types are best solved with Desmos, such as systems of equations and quadratics, and which are faster to solve manually.
- Include timed Desmos drills. Set aside short practice sessions focused on Desmos-friendly questions to improve speed, confidence, and decision-making under test conditions.
Common Desmos SAT Mistakes Students Make
- Missing parentheses: Expressions like (2x + 3)^2 and 2x + 3^2 produce very different results. Encourage students to group terms correctly before graphing.
- Using the wrong multiplication symbol: Students sometimes confuse the multiplication symbol (×) with the variable x. Teach them to use * or simply type 2x when multiplying by a variable.
- Degree vs. radian mode: Trigonometry questions can produce incorrect graphs if the calculator is in the wrong angle mode. Remind students to check the setting before solving trig problems.
- Incorrect graph window: A graph may appear blank or incomplete simply because the viewing window is too narrow or too zoomed in. Students should know how to reset or adjust the graph before assuming they've made a mistake.
- Misusing sliders: Sliders are a great learning tool but aren't a shortcut for solving SAT questions. Encourage students to use them during practice to understand function transformations, not as a substitute for problem-solving.
- Typing syntax errors: Missing operators, incorrect exponents, or incomplete equations can prevent Desmos from graphing correctly. Encourage students to review their input whenever the graph doesn't match their expectations.
Practice Desmos Before Test Day
Knowing how to use Desmos is only part of Digital SAT preparation. Students also need to become comfortable using it within the actual testing environment, where pacing, navigation, and question flow all affect performance.
Encourage your students to start with the Bluebook app, as its official practice tests replicate the Digital SAT experience, including the built-in Desmos graphing calculator and adaptive test format. It’ll help students build familiarity with the interface before exam day.
Tutors should also encourage students to use official College Board practice resources alongside Bluebook. These materials reinforce the skills and question types students will encounter on the Digital SAT while ensuring they're practicing with authentic content.
Once students are comfortable with the official tools, they benefit from additional full-length practice in a realistic testing environment. EdisonOS offers a Bluebook-like interface with an integrated Desmos calculator, adaptive Digital SAT mock tests, and detailed performance analytics. This allows tutors to monitor student progress, identify skill gaps, and prepare students for test day with greater confidence.
The more closely practice mirrors the real Digital SAT, the more students can focus on solving problems instead of learning the testing interface on exam day.
Why SAT Tutors Choose EdisonOS for Digital SAT Prep
Preparing students for the Digital SAT requires more than practice questions. Tutors need a platform that recreates the real testing experience while providing actionable insights after every mock test.
With EdisonOS, tutors can:
- Train students in a Bluebook-like interface that closely mirrors the official Digital SAT, including navigation, question flow, and test-day tools.
- Use the integrated Desmos calculator so students practice with the same tool they'll use on exam day.
- Assign adaptive Digital SAT mock tests that simulate the official testing experience and build exam confidence.
- Track performance with detailed analytics, including scaled scores, skill analysis, question analysis, and time analysis.
- Monitor student progress through tutor dashboards and reports, making it easier to identify weak areas and personalize instruction.
- Review detailed student reports, including skill trends and question-level insights, to guide follow-up sessions.
Book a demo to see how EdisonOS helps tutors deliver a more effective SAT prep experience.
Conclusion
The Desmos SAT Calculator is one of the biggest advantages students have on the Digital SAT Math section. But success is less about knowing how to use Desmos and more about knowing when to use it.
As a tutor, help students build that judgment through consistent practice in a realistic Digital SAT environment. The more familiar they are with Desmos before test day, the more confident and efficient they'll be during the exam.
Sign up for a free trial with EdisonOS and give your students a Bluebook-like testing experience with integrated Desmos, adaptive mock tests, and detailed performance analytics.
Frequently Asked Questions
.svg)



.png)

.avif)